Figures & data
Table 1. Descriptive characteristics of individuals in the study.
Figure 1. Comparison of responses to AC and RE at T1 (A) and T2 (B). Venn diagrams indicate number of metabolites significantly altered by each exercise from baseline value at that time. Heat map includes listing of metabolites corresponding to Venn diagrams comparing AC to RE for the labeled time and exercise.
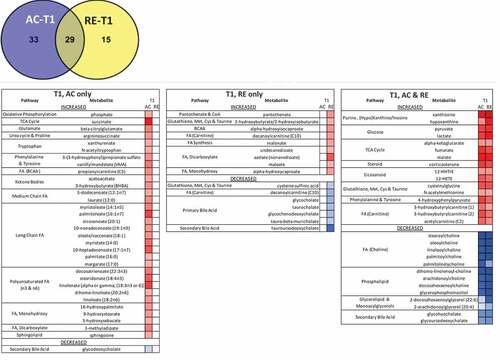
Figure 1. (Continued)
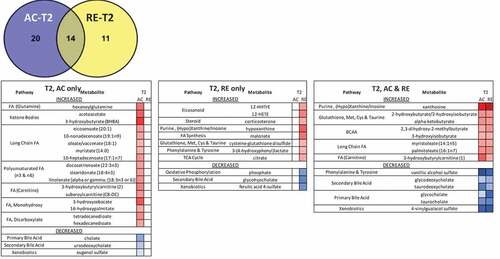
Figure 2. Heatmaps, with numeric data for significantly altered metabolites. Values expressed as a percentage of resting level. Red = increase, blue = decrease from baseline. Significant changes in bold. A) FA metabolites in response to AC and RE. Substantially more elevation in FA metabolism in response to AC was seen at both time points. Additionally, FA metabolites showing a response at RE-T1 tended to be markers of distressed or inadequate mitochondrial FA processing (malonate and most dicarboxylate- and monohydroxy-FA’s). A split in PUFA metabolism between n3 and n6 metabolites following exercise was evident. FA metabolites with antioxidant properties (3-methyladipate and 16-hydroxypalmitate) were greater in AC > RE. Values in bold are significantly different across exercises at that time point. B) Heat map of TCAC intermediates & β-citrylglutamate levels immediately (T1) and 1-hour (T2) post-exercise. Values expressed as a % of resting level at each time point. C) Fatty-acylcholines & phospholipids significantly (p < 0.05, q < 0.1) altered > 2-fold. Values expressed as % of resting level at each time point. Significant changes are shaded blue -darker = greater magnitude of change. AC = aerobic exercise; RE = anaerobic exercise; T1 = immediate post = exercise; T2 = 60-minutes post-exercise. Bold indicates a significant change from baseline, p < 0.05 & q < 0.1. D) Outline of major metabolic pathways activated by exercise. AC elicited greater lipid metabolism due to greater FA substrate selection and a metabolomic profile indicating more membrane turnover and downstream lipid mediator signaling. RE elicited greater anaerobic glycolysis and purine salvage due to a greater demand on rate of energy production. This highlights the fundamental difference between AC and RE as volume- versus intensity-dependent stressors, respectively.
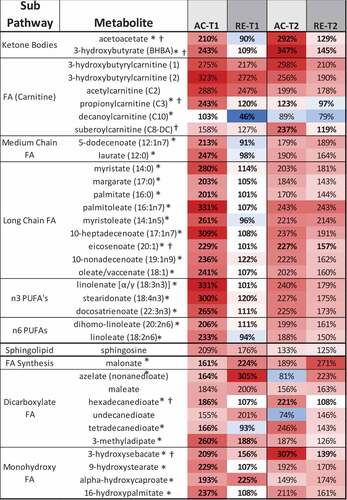
Figure 2. (Continued)
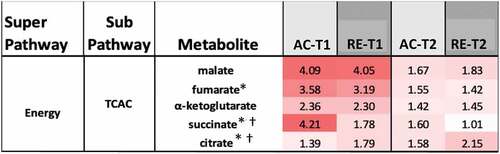
Figure 2. (Continued)
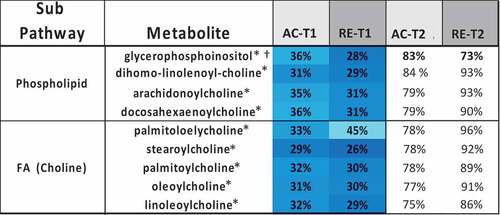
Figure 2. (Continued)
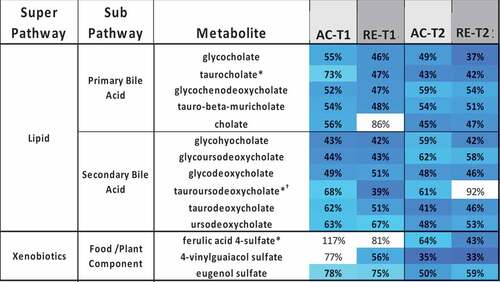
Figure 2. (Continued)
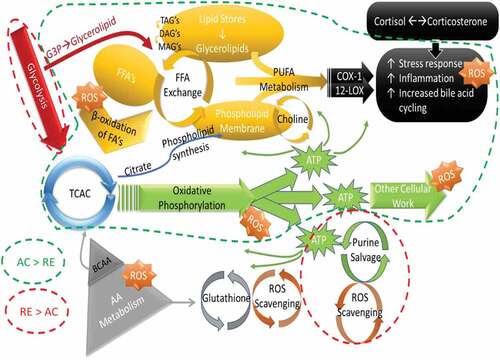
Figure 3. Glucose Metabolism is higher at T1 for RE. (T1) for aerobic (AC) and anaerobic exercise (RE). After 1-hour of recovery (T2) the pro-inflammatory metabolites returned to baseline following AC, but remained elevated following RE.
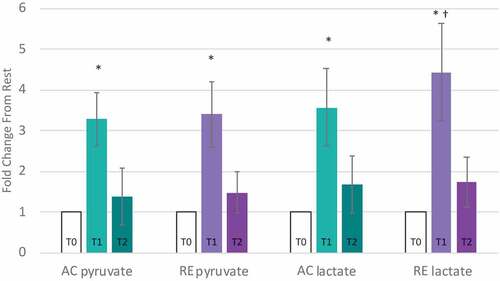
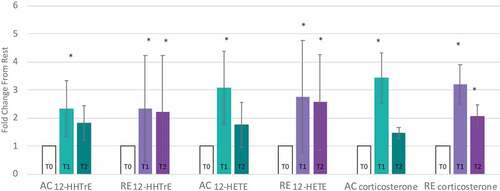
Figure 4. Responses of purine salvage markers (xanthosine & hypoxanthine) to aerobic (AC) and anaerobic exercise (RE) expressed as fold-of change form resting value. T0: resting, T1: immediately post-exercise, T2: 1-hour post-exercise.
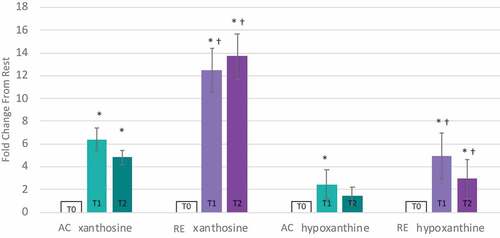
Figure 5. Pro-inflammatory markers are elevated immediately following exercise (T1) for aerobic (AC) and anaerobic exercise (RE). After 1-hour of recovery (T2) the pro-inflammatory metabolites returned to baseline following AC, but remained elevated following RE.