Figures & data
Table 1. Materials and reagents information.
Figure 1. AA stimulates prostaglandin production in a dose-dependent manner. Prostaglandin hormones PGE2 and PGF2α were measured using ELISAs. (A) PGE2 and (B) PGF2α concentrations are shown for proliferating myoblasts treated with AA for 72 hours. (C) PGE2 and (D) PGF2α concentrations for differentiating myotubes treated with AA for 48 hours. Data are expressed as mean ± SEM (***p < 0.001; **p < 0.01; *p < 0.05; all compared to respective control).
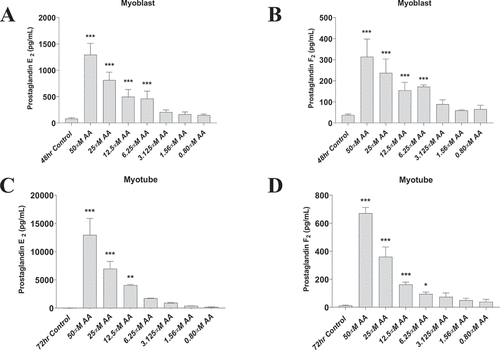
Figure 2. AA reduces myoblast viability at high and moderate doses. Skeletal muscle myoblasts were proliferated for 48 hours with various concentrations of AA. (A) Cell viability was measured using 3-(4, 5-Dimethylthiazol-2-Yl)-2, 5-Diphenyltetrazolium Bromide assay. Viability was affected at concentrations of 50, 25, 12.5, 6.25, 3.15, and 1.56 µM AA. (B) Cell counts were measured using Trypan Blue (0.4%) and an automated counter. Data are expressed as mean ± SEM (***p < 0.001; **p < 0.01; *p < 0.05; all compared to control). n = 3 independent experiments.
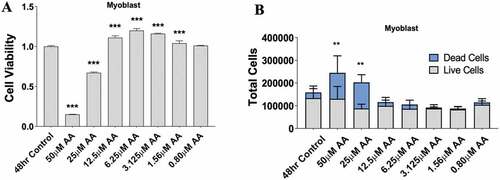
Figure 3. AA reduces myotube formation in a dose-dependent manner. Differentiating skeletal muscle myoblasts were treated with decreasing concentrations of AA for 72 hours and then fixed and prepared for fluorescent confocal microscopy and gene using an antibody that recognizes embryonic myosin heavy chain. (A) Representative images were generated using a Zeiss LSM 700 using Zen software. AA concentrations are provided for each image. Analyses of images from two independent experiments for (B) myotube area, (C) myotube fusion percentage, and (D) total DAPI. Myotubes were also analyzed for myosin heavy chain mRNA expression of (E) MYH1, MYH2, MYH3, MYH7, and MYH8. Data are expressed as mean ± SEM (***p < 0.001; **p < 0.01; *p < 0.05; all compared to control). n = 3 independent experiments.
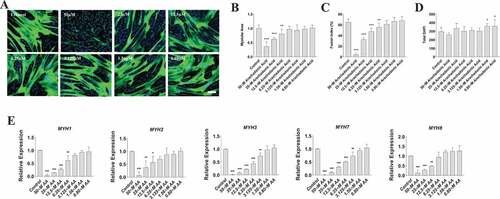
Figure 4. High doses of AA impair the protein kinase B/AKT pathway in proliferating human skeletal myoblasts. Western immunoblotting was performed using lysates from human skeletal myoblasts that were treated for 48 hours with AA. (A) Representative images are shown. Densiometric quantification was used and proteins were normalized to their respective totals for (B) p-TSC2 S138, (C) p-AKT S473, (D) p-S6 235, and (E) p-4EBP1 S65. Data are expressed as mean ± SEM and represent four independent experiments (***p < 0.001; **p < 0.01; *p < 0.05; all compared to control). n = 4 independent experiments.
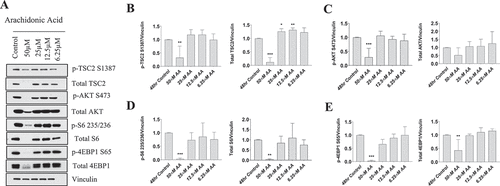
Figure 5. Effect of AA on COX inflammatory pathway in proliferating human skeletal myoblasts. (A) PTGS1 and PTGS2 mRNA levels were examined in cells treated with various concentrations of AA for 48 hours. COX protein levels were examined in cells treated with various concentrations of AA or equivalent diluent (ethanol) for 48 hours. (B) Representative western blots are shown; purified COX proteins were run to ensure accuracy of band identification. (C) Densiometric quantifications of Cox-1 and Cox-2. Data are expressed as mean ± SEM and represent three independent experiments (***p < 0.001; **p < 0.01 *p < 0.05; all compared to control).
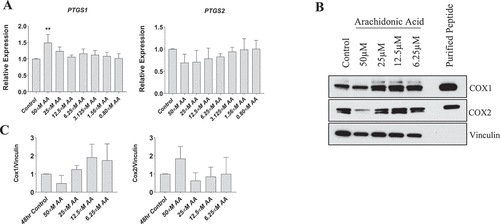
Figure 6. AA does not impair the protein kinase B/AKT pathway in differentiating human skeletal myotubes. Various concentrations of AA were used to treat human skeletal myotubes for 72 hours. (A) Representative western blots are shown. Densitometric quantification was used and proteins were normalized to their respective totals for (B) p-AKT, (C) p-S6 235, (D) p-S6 240, and (E) p-p70 T389. Data are expressed as mean ± SEM and represent four independent experiments (***p < 0.001; **p < 0.01 *p < 0.05).
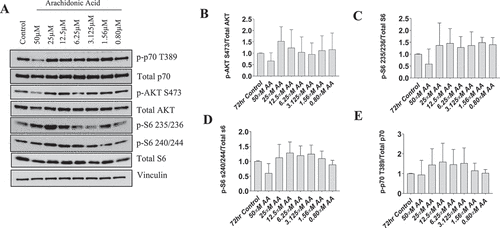
Figure 7. Effect of AA on COX inflammatory pathway in differentiating human skeletal myotubes. (A) PTGS1 and PTGS2 mRNA levels were examined in cells treated with various concentrations of AA for 48 hours. COX protein levels were examined in cells treated with various concentrations of AA or equivalent diluent (ethanol) for 48 hours. (B) Representative western blots are shown; purified COX proteins were run to ensure accuracy of band identification. (C) Cox1 and Cox2 protein levels in cells treated with various concentrations of AA for 48 hours. Data are expressed as mean ± SEM and represent three independent experiments (***p < 0.001; **p < 0.01 *p < 0.05; compared to control).
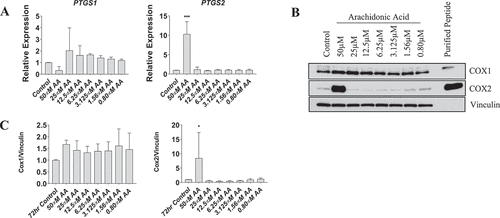
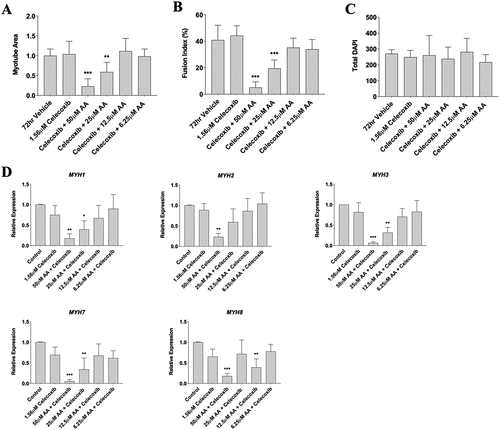
Figure 8. Celecoxib does not attenuate the effect of AA at high doses on myotubes. Differentiating skeletal muscle myoblasts were treated with decreasing concentrations of AA and Celecoxib for 72 hours and then fixed and prepared for fluorescent confocal microscopy and gene using an antibody that recognizes embryonic myosin heavy chain. Analyses of images experiments for (A) myotube area, (B) myotube fusion percentage, and (C) total DAPI. Myotubes were also analyzed for myosin heavy chain mRNA expression of (D) MYH1, MYH2, MYH3, MYH7, and MYH8. Data are expressed as mean ± SEM (***p < 0.001; **p < 0.01; *p < 0.05; all compared to control). n = 3 independent experiments.