
Figures & data
Figure 1. Timeline and exercise testing protocol.
Figure 2. Consort flow diagram.
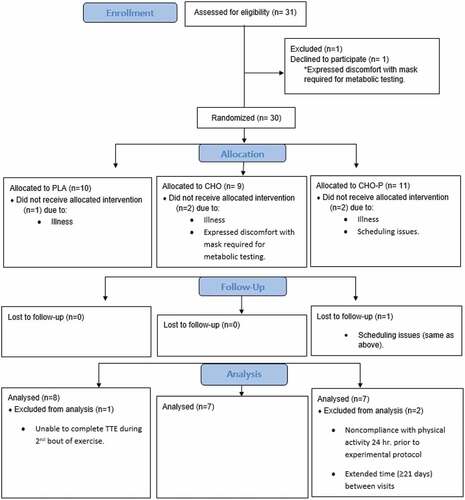
Table 1. Mean and SD values for demographic data.
Figure 3. Group mean values (±SE) for posttest time to exhaustion scores adjusted for the initial differences in the pretest time to exhaustion (covariate). The adjusted pretest value was 203.05 sec. *Indicates significant difference compared to PLA.
Table 2. Mean and SD values for time to exhaustion (sec) at pretesting and posttesting for each group.
Table 3. Mean and SD values for heart rate recovery index at pretesting and posttesting for each group.
Table 4. Total energy intake and macronutrient values are reported for 13 of 22 participants. Values are expressed as mean ± standard deviation.
Table 5. Participant fluid loss pre-post exercise and total volume consumed during the 2-hour recovery period. Values are expressed as mean ± standard deviation.