
Figures & data
Table 1. Participant characteristics.
Figure 1. Positioning optical detection probe of near-infrared spectroscopy (NIRS). The whole body 18F-fluorodeoxyglucose positron emission tomography (PET) image indicates the metabolically active sub-navel and cerebral regions where the optical detection probes of near-infrared spectroscopy (NIRS) were placed (indicated by red arrows). PET scan was conducted 1 h after injecting glucose solution containing 18F-fluorodeoxyglucose (400 MBq) by a young participant (24 y) before scanning under overnight fasted condition.
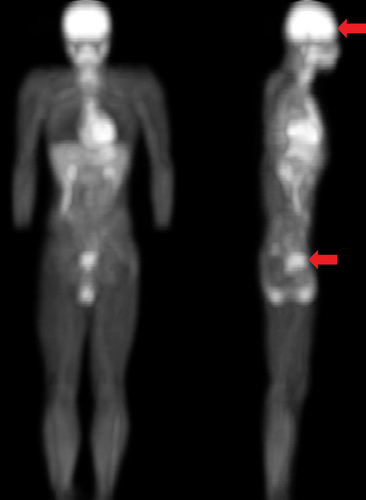
Figure 2. Flowchart of the study.
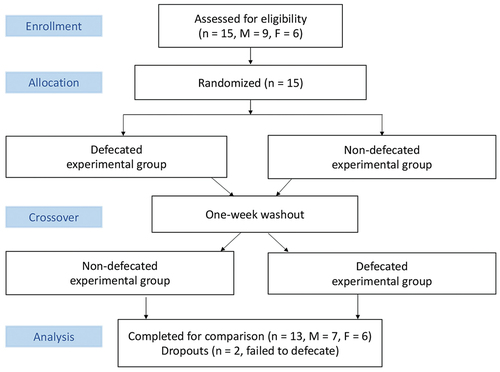
Figure 3. Defecation improved high-intensity cycling performance. Ten out of thirteen triathletes showed improved cycling time-to-exhaustion test (TTE) at 80% VO2max following defecation (TTE difference: defecated minus non-defecated in second) by~17%. Endurance performance was conducted 90 min (0730 am) after the defecation at 18.5 Celsius degree and 60% humidity following a 10-h overnight fasting. Abbreviation: P, participant. Male: P2, P3, P4, P5, P8, P9, P11; Female: P1, P6, P7, P10, P12, P13. Values are presented as mean ± standard error.
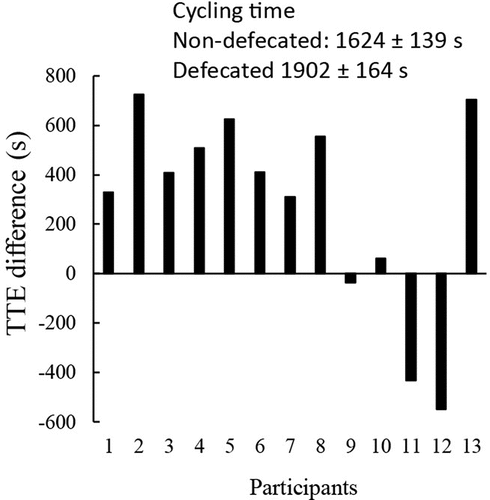
Figure 4. Defecation enhanced blood supply to prefrontal cerebral region during exercise. Cycling at 80% VO2max decreased cerebral oxygenation (oxyhemoglobin to total hemoglobin ratio) from pre-exercise level for both defecated and non-defecated conditions (p < 0.01) (A: left panel, total hemoglobin trajectory line; right panel, average change of entire cycling period from baseline). Cerebral blood distribution in the prefrontal brain increased to compensate the deoxygenation during cycling (B: left panel, total oxygenation trajectory line; right panel, average change of entire cycling period from baseline). Since each triathlete had different cycling time to fatigue, time is displayed in a relative scale (% time completed). Values are presented as mean ± standard error. *Significant difference from Non-defecated condition, p < 0.05. †Significant difference from pre-exercise baseline, p < 0.05.
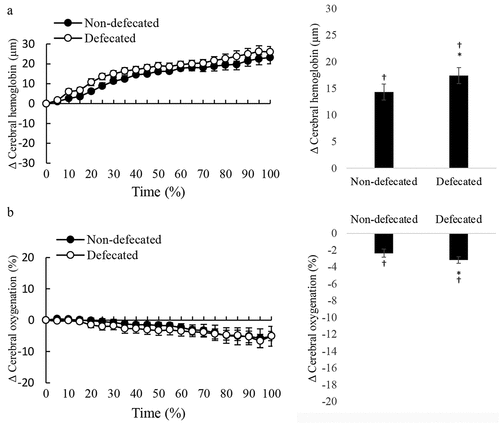
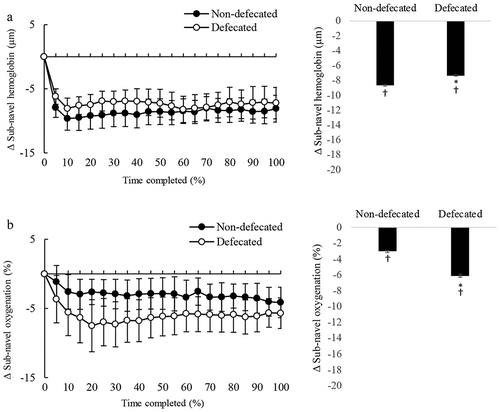
Figure 5. Defecation enhanced oxygen consumption in the sub-navel region. Blood distribution (total hemoglobin) in sub-navel region decreased from pre-exercise level (p < 0.05) to a similar extent for defecated and non-defecated conditions (A: left panel, total hemoglobin trajectory line; right panel, average change of entire exercise period from baseline). Defecation further lowered the decreased sub-navel oxygenation (oxyhemoglobin to total hemoglobin ratio) induced by cycling (p < 0.01) (A: left panel, oxygenation trajectory line; right panel, average change of entire cycling period from baseline). Since each triathlete had different cycling time to fatigue, time is displayed in a relative scale (% time completed). Values are presented as mean ± standard error. *Significant difference from Non-defecated condition, p < 0.05. †Significant difference from pre-exercise baseline, p < 0.05.
Data availability statement
Data is available upon reasonable request.