
Figures & data
Figure 1. Experimental schematic showing timings (minutes) and procedures for warm up and battery of team sport-specific exercise tests. BG = blood gas (pH, bicarbonate, hemoglobin, hematocrit, sodium, potassium), La = blood lactate, GI = gastrointestinal discomfort questionnaire, TA = treatment assignment questionnaire.
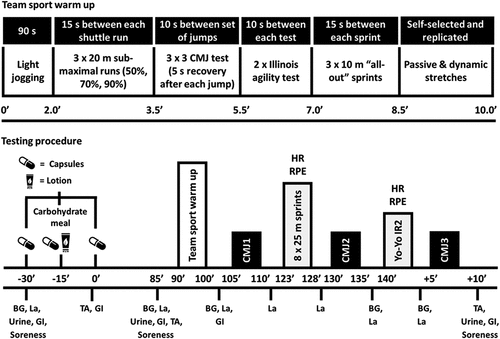
Figure 2. Total distance covered during the Yo-Yo IR2 test. Bars represent mean values. Individual treatment differences depicted by symbol/line. SB-ORAL = oral sodium bicarbonate, SB-LOTION = topical sodium bicarbonate, PLA = placebo; * greater than PLA (p < 0.05). .
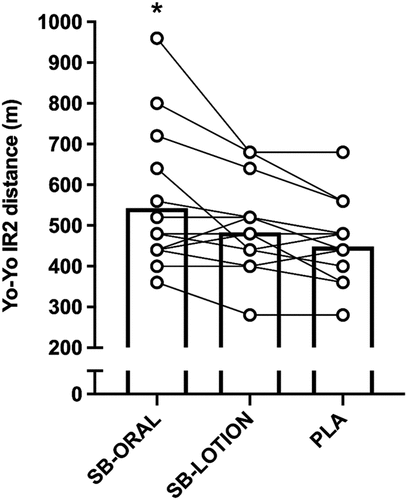
Table 1. Completion times (s) for individual sprints during the 8 × 25 m repeated sprint test.
Figure 3. (a, b) 8 × 25 m repeated sprint test average times (a) and total times (b). Bars represent mean values. Individual treatment differences depicted by symbol/line. SB-ORAL = oral sodium bicarbonate, SB-LOTION = topical sodium bicarbonate, PLA = placebo; * faster than PLA (p < 0.05).
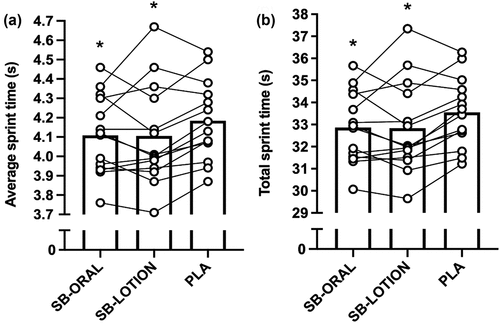
Figure 4. (a, b) Mean ± SD responses for blood acid–base balance (a, pH; b, bicarbonate). Bars represent mean values. Some SD error bars were removed for clarity. SB-ORAL = oral sodium bicarbonate, SB-LOTION = topical sodium bicarbonate, PLA = placebo; ^ elevated for SB-ORAL compared with SB-LOTION and PLA (p < 0.05).
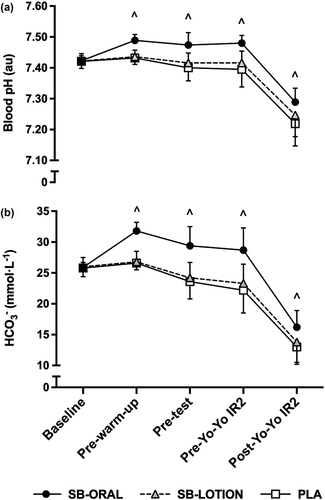
Table 2. Blood lactate and electrolyte response throughout the battery of team sport-specific exercise tests.
Figure 5. Mean ± SD for changes in plasma volume (PV) from baseline. Bars represent mean values. Some SD error bars were removed for clarity. SB-ORAL = oral sodium bicarbonate, SB-LOTION = topical sodium bicarbonate, PLA = placebo; ^ SB-ORAL higher than SB-LOTION and PLA, * SB-ORAL higher than PLA (p < 0.05).
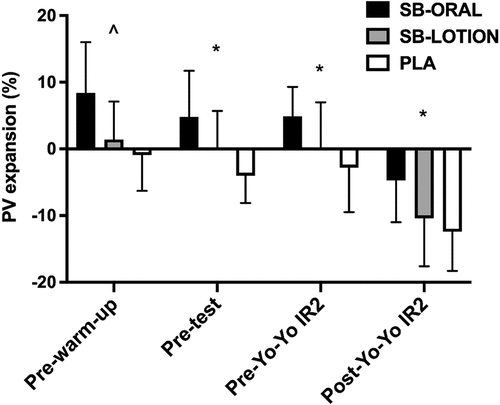
Table 3. RPE (au.) after each of the 8 × 25 m repeated sprints and post-Yo-Yo IR2.
Data availability statement
The datasets used and/or analyzed during the present study are available from the corresponding author on reasonable request https://shura.shu.ac.uk/.