
Figures & data
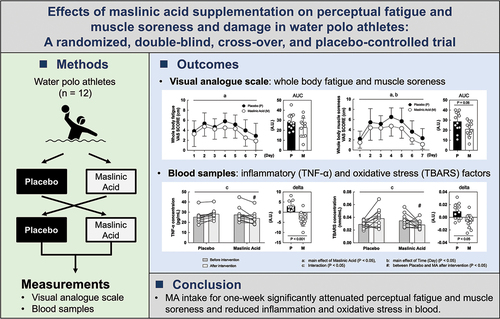
Table 1. Grouping condition and characteristics of participants.
Table 2. Training schedule from Day 1 to Day 7 during intervention.
Figure 1. Study design.
Figure 2. MA intake attenuates perceptual fatigue and muscle soreness during the one-week intervention. (a) whole body fatigue, (b) whole body muscle fatigue, (c) eye strain, (d) whole-body muscle soreness,(e) shoulder muscle soreness, (f) chest muscle soreness, (g) lower back muscle soreness and (h) femur muscle soreness. All data are expressed as the means and individual values (n = 12). Significant differences were assessed using a two-way ANOVA followed by Tukey’s multiple comparisons test. Significant differences: a: main effect of MA (P < 0.05); (a): main effect of MA (P < 0.1); b: main effect of time(P < 0.05); c: interaction of MA and time (P < 0.05); #: between placebo and MA after intervention (P < 0.05). Significant differences in AUC are shown individually.
Figure 3. MA intake inhibits the accumulation of inflammation in the blood during a one-week intervention. Levels of (A) TNF-α, (B) hs-CRP, (C) creatin and (D) creatinine concentration. All data are expressed as the means and individual values (n = 12). Paired data are connected with lines consistently across all figures where possible. Significant differences were assessed by a two-way ANOVA followed by Tukey’s multiple comparisons test. Significant differences: c: interaction of MA and time (P < 0.05); #: between placebo and MA after intervention (P < 0.05). Significant differences in the delta are shown individually.
Figure 4. MA intake inhibits oxidative stress accumulation in blood during a one-week intervention. All data are expressed as means and individual values (n = 12). Paired data are connected with lines. Significant differences were assessed by a two-way ANOVA followed by Tukey’s multiple comparisons test. Significant differences: c: interaction of MA and time (P < 0.05); #: between placebo and MA after intervention (P < 0.05). Significant differences in the delta are shown individually.
Figure 5. Inflammatory related proteins are decreased within myotubes treated with serum from MA-conditioned participants after intervention. (a) western blot band images, protein expression levels of (b) TNF-α, (c) NF-κB, and (d) COX2. All data are expressed as means and individual values (n = 12). Paired data are connected with lines consistently across in all figures. Significant differences were assessed by a two-way ANOVA followed by Tukey’s multiple comparisons test. Significant differences: b: main effect of time (P < 0.05); c: interaction of MA and time (P < 0.05); #: between placebo and MA after intervention (P < 0.05). Significant differences in the delta are shown individually.
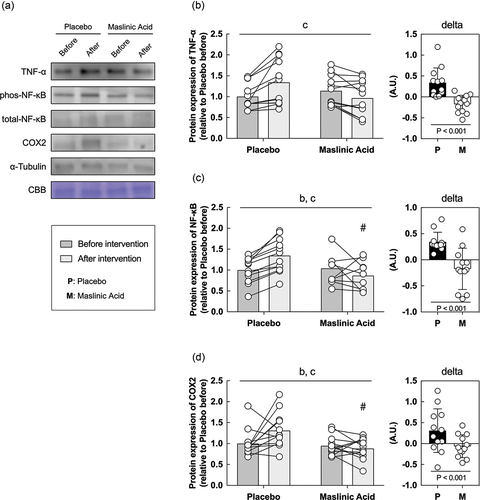
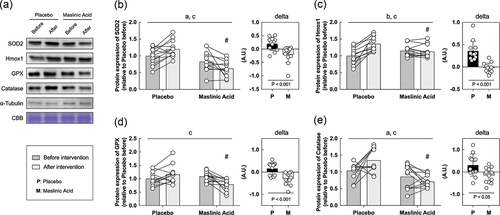
Figure 6. Antioxidant factor-related proteins are also decreased within myotubes treated with serum from MA-conditioned participants after intervention. (a) western blot band images, protein expression levels of (b) SOD2, (c) Hmox1, (d) GPX, and (e) catalase. All data are expressed as means and individual values (n = 12). Paired data are connected with lines consistently across in all figures. Significant differences were assessed by a two-way ANOVA followed by Tukey’s multiple comparisons test. Significant differences: a: main effect of MA (P < 0.05); b: main effect of time (P < 0.05); c: interaction of MA and time (P < 0.05); #: between placebo and MA after intervention (P < 0.05). Significant differences in the delta are shown individually.
Data availability statement
The sharing of data in an open-access repository was not included in our participants consent. Thus, in accordance with standard ethical practice, data may only be available on request from the corresponding author.