Figures & data
Figure 1. Test protocol. Riding start time (pre-exercise, pre-Ex) was set as 0 min. Breakfast: immediately after fasting blood collection; preparation: 90 min post breakfast; SS: sitting still (20 min); PE: prolonged exercise (90 min), which consisted of a steady-state cycling period (85 min) and a sprint (5 min); TT: time trial (20 min); recovery period including three durations of 60 min between PE and TT, 15 min post TT, and 19 h till next fasting. Using a crossover design, each participant performed the same test two times (ingestion of a food-derived oligopeptide supplement or control beverage) with a 2-week washout period, respectively. F: fasting; NF: next fasting. BG: blood glucose; FAAs: free amino acids; TGs: triglyceride species (omics analysis); TCA: tricarboxylic acid.
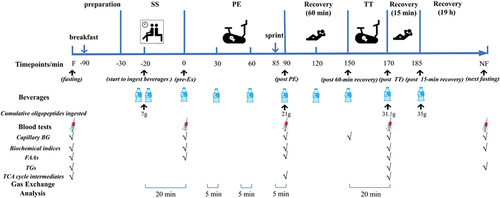
Table 1. The content of amino acids in raw food-derived oligopeptide powder (g/100 g).
Figure 2. FOPS led to alterations in levels of plasma FAAs and their metabolic intermediates. a, total FAAs; b-g, plasma FAA levels for diverse categories; h, BU level; i, a heatmap of plasma FAAs and their metabolite levels from low (light blue) to high (deep red), with values and significant changes between groups at each timepoint listed in Table S2; j, a Venn Diagram of the OPLS-DA score plot; k, plasma differential FAAs at diverse timepoints; b overview of pathway enrichment analysis for plasma FAAs. Significant pathway names are listed. Data are presented as mean±S.E. (n = 16 per group). C, control; T, FOPS; Ex, exercise; F: fasting, NF: next fasting. Compared between groups: *p < .05, **p < .01, ***p < .001. FOPS: food-derived oligopeptide supplementation; FAAs: free amino acids.
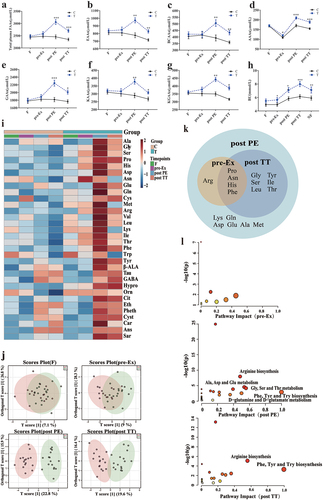
Figure 3. FOPS resulted in changes in serum lipids and plasma TG species. a-f, serum lipids (TG, LDL-C, TCH and HDL-C) and TG degradation products (NEFA and β-HBA); g, a heatmap of net changes in plasma TGs from low (light blue) to high (deep red) at 170 min and at NF vs. F; h, average alteration in plasma TG species relative to that at F. Data are presented as mean±S.E. (n = 16 per group). C, control; T, FOPS; Ex, exercise; F: fasting, NF: next fasting. *p < .05, **p < .01, ***p < .001, ****p < .0001. FOPS: feed-derived oligopeptide supplementation; TG: triglycerides; LDL-C: low-density lipoprotein cholesterol; TCH: total cholesterol; HDL-C: high-density lipoprotein cholesterol; NEFA: non-esterified fatty acid; β-HBA: β-hydroxybutyric acid.
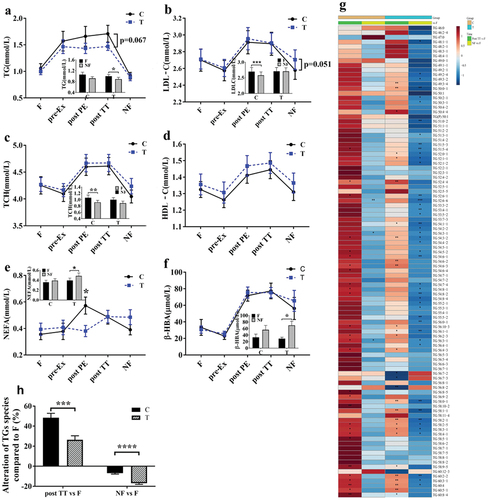
Figure 4. Results of gas exchange analysis. a-d: dynamic curves for average fat and CHO oxidation rates, RER, and VO2 during SS, PE, and TT, respectively. e-h: average fat and CHO oxidation rates, RER, and VO2 during separate durations of SS, PE, and TT. Data are presented as mean±S.E. (n = 16 per group). C, control; T, FOPS. F: fasting, NF: next fasting. SS: sitting still (20 min), PE: prolonged exercise (90 min) including a steady-state cycling period (85 min) and a sprint (5 min), TT: time trial (20 min). A paired samples t-test was performed to compare the difference during the same duration between two groups. *p < 0.05, **p < 0.01, ***p < 0.001. CHO: carbohydrate; RER: respiratory exchange rate.
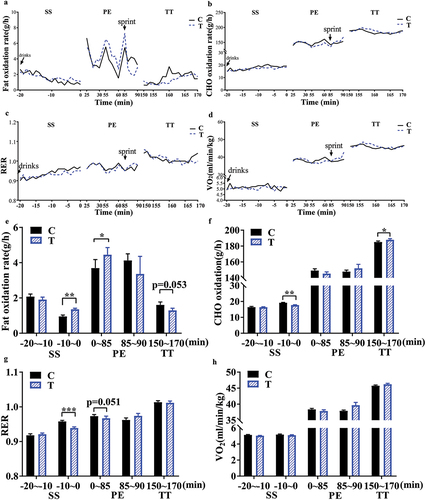
Figure 5. Levels of plasma TCA cycle intermediates and blood glucose. a-h, intermediates; i, blood glucose and net change relative to previous timepoint (inserted graph). Data are presented as mean±S.E. (n = 16 per group). C, control; T, FOPS. F: fasting, NF: next fasting. *p < 0.05. TCA: tricarboxylic acid cycle.
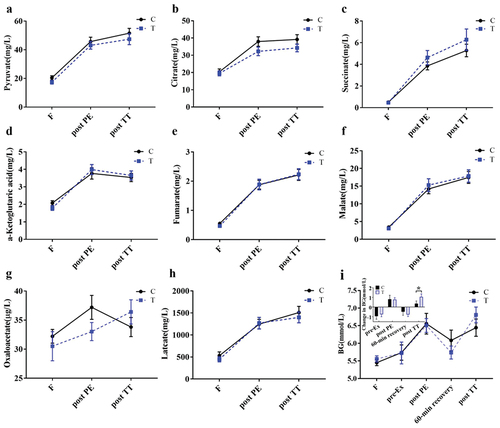
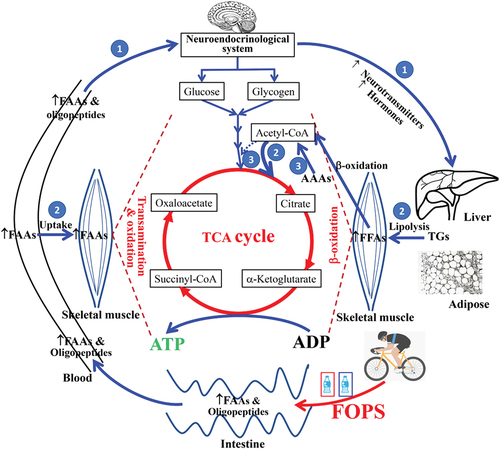
Figure 6. A draft of the proposed mechanism for FOPS-promoted lipolysis and fat oxidation during prolonged exercise. ↑: increased; thin blue solid line: enhanced or accelerated; thick blue/red solid line: strongly enhanced; thin blue dotted line: inhibition