
Figures & data
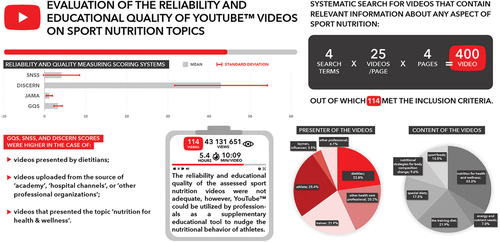
Table 1. Sport nutrition scoring system.
Figure 1. Selection of videos included in the study.
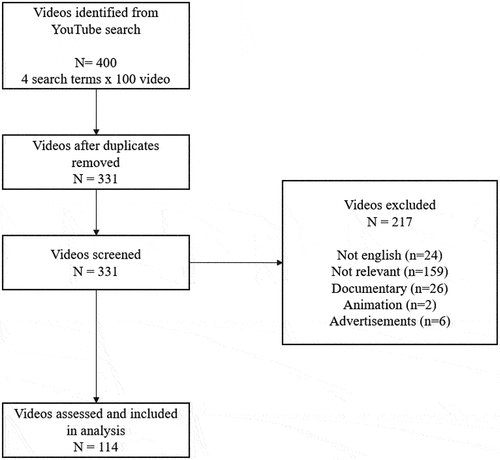
Table 2. Characteristics of the videos.
Table 3. Distribution of presenters, video subjects, target population, and source of upload of the included sport nutrition videos.
Table 4. Results on the reliability and quality measuring scoring systems.
Table 5. Inter-rater reliability for scoring schemes.
Table 6. Associations between the quality scores and video characteristics.
Table 7. Associations between the quality scores and quantitative characteristics of the videos.
Table 8. Correlation matrix between scores.
Table 9. Variable and their levels included the ordinal regression.
Table 10. Results of ordinal regression.
Table 11. Results of the omnibus likelihood ratio tests.