757
Views
0
CrossRef citations to date
0
Altmetric
Research Article

6-week time-restricted eating improves body composition, maintains exercise performance, without exacerbating eating disorder in female DanceSport dancers

ORCID Icon, ORCID Icon, , , , , , , , & show all
Article: 2369613 | Received 20 Nov 2023, Accepted 13 Jun 2024, Published online: 21 Jun 2024

Figures & data

Figure 1. Study design. TRE, Time-restricted eating; PA, Physical activity; EAT-26: Eating attitudes test.

Figure 1. Study design. TRE, Time-restricted eating; PA, Physical activity; EAT-26: Eating attitudes test.

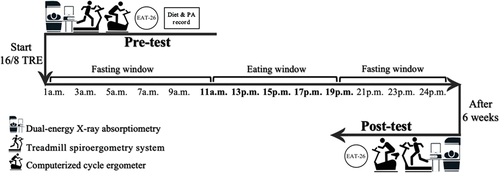
Table 1. Baseline characteristics.

Figure 2. The line chart of hunger levels in TRE group during the 6-week TRE intervention.

Figure 2. The line chart of hunger levels in TRE group during the 6-week TRE intervention.

Table 2. Total calorie intake and macronutrients at baseline and during TRE in TRE and ND group.

Table 3. ED attitudes and behaviors at baseline and posttest in TRE and ND group.

Figure 3. The violin plots of changes of waist circumference, hip circumference, body mass index (BMI), fat mass (FM) and fat-free mass (FFM) in TRE and ND group at baseline and after TRE intervention. The thick lines indicate the median value in each group. The thin lines represent each interquartile range. The pound sign (#) illustrates within-group differences (p < 0.05).

Figure 3. The violin plots of changes of waist circumference, hip circumference, body mass index (BMI), fat mass (FM) and fat-free mass (FFM) in TRE and ND group at baseline and after TRE intervention. The thick lines indicate the median value in each group. The thin lines represent each interquartile range. The pound sign (#) illustrates within-group differences (p < 0.05).

Figure 4. The violin plots of changes of heart rate (HR), maximum oxygen intake (VO2max), oxygen intake (VO2/kg), carbon dioxide production (VCO2) and anaerobic threshold (AT) in TRE and ND group at baseline and after TRE intervention. The thick lines indicate the median value in each group. The thin lines represent each interquartile range.

Figure 4. The violin plots of changes of heart rate (HR), maximum oxygen intake (VO2max), oxygen intake (VO2/kg), carbon dioxide production (VCO2) and anaerobic threshold (AT) in TRE and ND group at baseline and after TRE intervention. The thick lines indicate the median value in each group. The thin lines represent each interquartile range.

Figure 5. The violin plots of changes of peak power (PP), PP/BW, average power (AP), AP/BW and power drop (PD) in TRE and ND group at baseline and after TRE intervention. The thick lines indicate the median value in each group. The thin lines represent each interquartile range. The asterisk mark (*) demonstrates between-group significant difference (p < 0.05). The pound sign (#) illustrates within-group differences (p < 0.05).

Figure 5. The violin plots of changes of peak power (PP), PP/BW, average power (AP), AP/BW and power drop (PD) in TRE and ND group at baseline and after TRE intervention. The thick lines indicate the median value in each group. The thin lines represent each interquartile range. The asterisk mark (*) demonstrates between-group significant difference (p < 0.05). The pound sign (#) illustrates within-group differences (p < 0.05).