Figures & data
Table 1. Sociodemographic Descriptions and Comparisons Between Groups
Table 2. Clinical Descriptions and Comparisons Between Groups
Table 3. Scores and Comparisons Between the Groups in the Dependent Variables: Impulsivity, Activation, and Behavioral Inhibition
Table 4. Scores and Comparisons Between the Groups in the Psychopathy-Dependent Variables
Table 5. Percentages of Prepulse Inhibition and Comparisons Between Groups
Figure 1. Prepulse inhibition percentage. Note. CRD = cocaine related disorder; SCZ = schizophrenia; ASPD = antisocial personality disorder; PPI = prepulse inhibition; ms = milliseconds. The a value was significantly higher than b (p = .011) and c (p = .004). The d variables had differences according PPI interval (CRD p = .031 and CRD + SCZ p = .016), that did not reach significance in the pairwise comparisons.
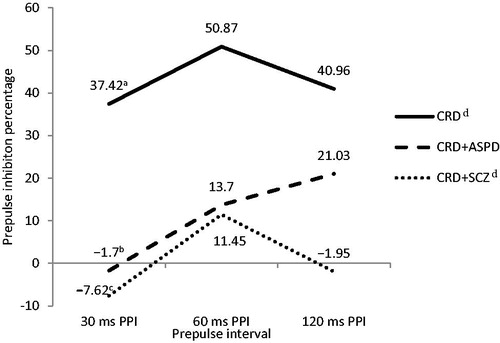
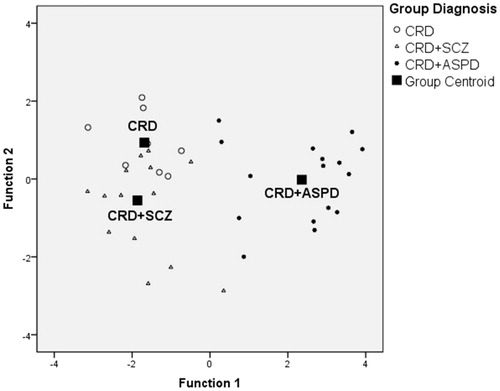
Figure 2. Scatter diagram for the discriminating functions. Note. CRD = cocaine related disorder; SCZ = schizophrenia; ASPD = antisocial personality disorder.