
Figures & data
Table 1. Patient and tumor characteristics. Samples taken from mature mesynchymal/epithelial (M), mature neuroglial (N) and immature neuroectodermal (I) areas.
Figure 1. A, Principal component analyses (PCA) based on the 5000 most variable genes after global gene expression analysis on 31 samples from 10 cases of SCT (blue), six samples from 3 NBs (red), 11 samples from 2 RMSs (grey) and 14 samples from 3 WTs (green). B, Targeted analysis of genes involved in germ cell differentiation. Heat map illustrating the genes in with most deviant expression in SCTs compared to the reference tumors (t-test, p = 0.0001, q = 0.0003). C, Heat map displaying the 45 genes showing the most significant difference in expression, when comparing SCT samples with neuroglial and immature histology (p-value = 1.06x10⁻⁵, q-value = 0.003). B and C, genes with high expression are depicted in red while genes with low expression are depicted in blue. See online version for color images.
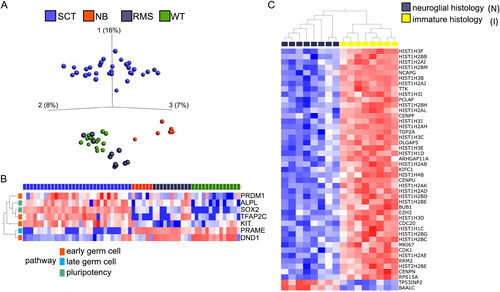
Figure 2. A, Principal component analyses of 31 samples from SCT (8 from mature SCTs in purple and 23 from immature SCTs in black) based on 15650 genes (variance/maximal variance= 0.1). B, Examples of enrichment plots generated from gene set enrichment analysis comparing mature SCTs with immature SCTs. C and D, Heat maps based on supervised hierarchal cluster analysis, displaying the 30 most differentially expressed genes when comparing mature and immature SCTs. The variables are listed according to fold change. * indicates genes correlating with immune effector processes. C, Genes with high expression in immature SCTs (t-test, p-value = 1.5x10⁻⁷, q = 8.7x10⁻⁵). D, Genes with high expression in mature SCTs (t-test, p-value= 2.5x10⁻⁶, q = 0.0014). See online version for color images.
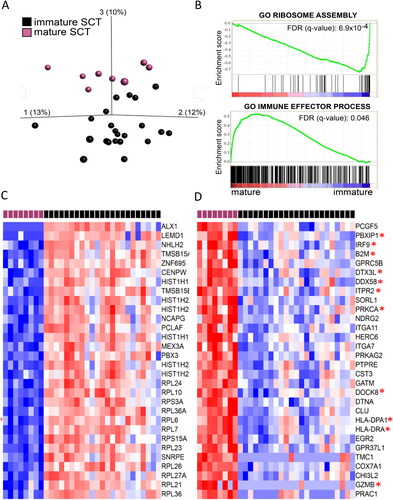
Table 2. Enriched signaling pathways in SCTs with mature histology compared to immature samples. The ten gene ontology pathways with the highest normalized enrichment scores (NES) are shown in the table (false discovery rate q-value < 0.05, nominal p-value <0.01).
Figure 3. CD68 immunohistochemical staining. A, Clustered CD68 positive cells in mature area of immature teratoma (Patient 4). Scale bar 200 µm. B, Typical clustering of CD68 positive cells in clefts between neuroglial cells, 10x low power field, scale bar 60 µm.
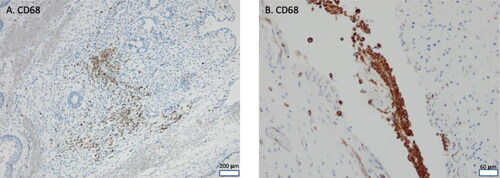
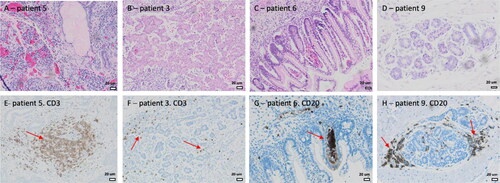
Figure 4. Immunohistochemical identification of lymphocytes in and around glandular and acinar epithelial elements in SCTs. A-D, Hematoxylin-eosin (HE) staining. E-H, Immunohistochemical staining for CD3+ T-lymphocytes (E and F) and CD20+ B-lymphocytes (G and H) show clusters in and around epithelial glandular and tubular structures (red arrows).
Availability of data
The data that support the findings of this study are available from the corresponding author upon reasonable request.