
Figures & data
Figure 1. YAP immunohistochemistry in hepatoblastoma tissues and paraneoplastic tissues. YAP expression was primarily localized in the nucleus. A, B and C are hematoxylin and eosin stained, (D) Adjacent tissues (x100). (E) Negative stain in HB (x100). (F) Positive stain in HB (x100).
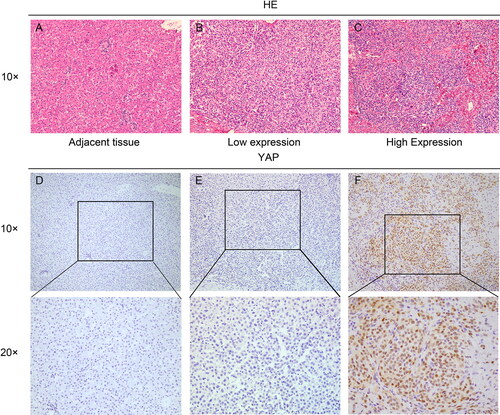
Figure 2. Microvessel density (MVD) in hepatoblastoma tissues. (A) Immunohistochemistry for CD34 in hepatoblastoma tissues; (a) Higher MVD expression (x100). (b) Lower MVD expression (x100). (B) Kaplan–Meier analysis of overall survival in patients with hepatoblastoma based on MVD (P = 0.009).
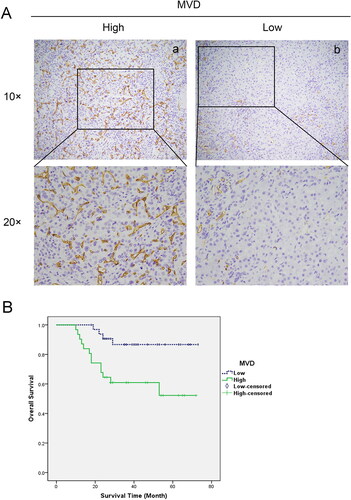
Figure 3. MVD and VEGF expression in hepatoblastoma. (A) Immunohistochemistry for VEGF in hepatoblastoma tissues (x100 and x200). (B) YAP high expression cases exhibited higher MVD (60.72 ± 28.22) than YAP low expression cases (37.71 ± 18.54) (P = 0.001).
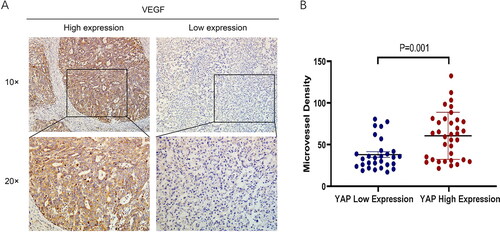
Table 1. Correlations between YAP, MVD and VEGF expression in HBs.
Table 2. Relationship between YAP expression and clinicopathological features of HBs.
Figure 4. Kaplan–Meier analysis of the overall survival of patients with hepatoblastoma based on YAP expression (P = 0.007).
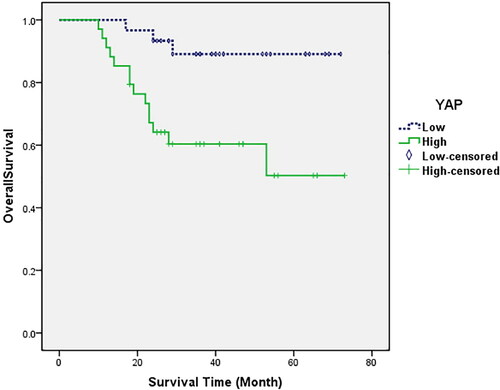
Table 3. Multivariate Cox regression analysis for overall survival in HBs.