968
Views
5
CrossRef citations to date
0
Altmetric
Articles

The legacy of Nazism: Historical analogies and support for the far right

, , &
Pages 300-317 | Received 04 Jul 2013, Accepted 10 Oct 2013, Published online: 14 Nov 2013

Figures & data

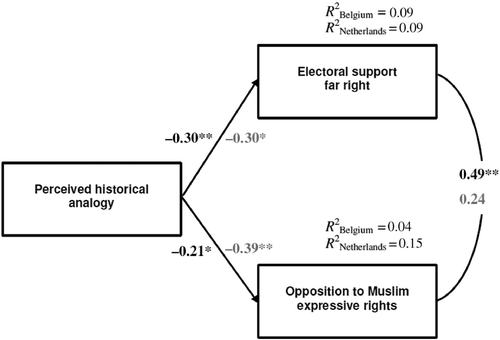
Figure 1 Path model of Study 1, with perceived historical analogy as the independent variable and electoral support for the far right and opposition to Muslim expressive rights as dependent variables. Path-coefficients are standardized estimates, which are displayed in black for Study 1A and in gray for Study 1B. Correlations between dependent variables are standardized. R2 = explained variance. *p < .05, **p < .01.

Table 1 Means, SDs and bivariate correlations for Study 1A (under the diagonal) and Study 1B (above the diagonal)
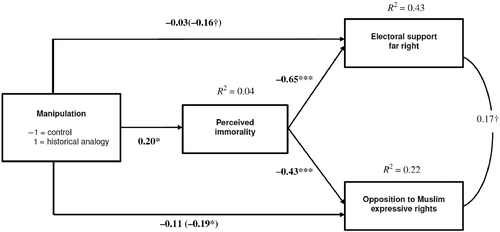
Figure 2 Path models of Study 2, with historical analogy manipulation as the independent variable and electoral support for the far right and opposition to Muslim expressive rights as dependent variables, and perceived immorality as the mediator. Path-coefficients are standardized estimates, and path-coefficients in brackets reflect direct effects. Correlations between dependent variables are standardized. R2 = explained variance. †p < .06, *p < .05, **p < .01, ***p < .001.

Table 2 Means and SDs by historical analogy and control condition, Study 2

Reprints and Corporate Permissions

Please note: Selecting permissions does not provide access to the full text of the article, please see our help page How do I view content?

To request a reprint or corporate permissions for this article, please click on the relevant link below:

Academic Permissions

Please note: Selecting permissions does not provide access to the full text of the article, please see our help page How do I view content?

Obtain permissions instantly via Rightslink by clicking on the button below:

If you are unable to obtain permissions via Rightslink, please complete and submit this Permissions form. For more information, please visit our Permissions help page.