3,377
Views
0
CrossRef citations to date
0
Altmetric
Articles

An agent-based model of indirect minority influence on social change and diversity

, &
Pages 18-38 | Received 24 Aug 2017, Accepted 05 Dec 2017, Published online: 13 Dec 2017

Figures & data

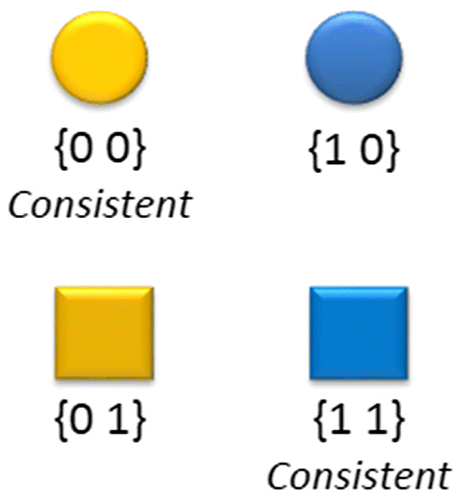
Figure 1. Four different agent states.

Figure 1. Four different agent states.

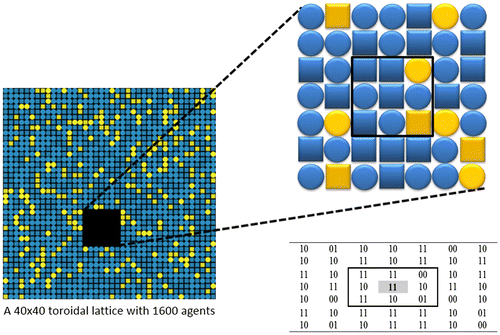
Figure 2. An example demonstrating the agent updating process.

Figure 2. An example demonstrating the agent updating process.

Figure 3. A workflow diagram portraying out attitude updating algorithm including majority and minority influences and a cognitive rebalancing process.
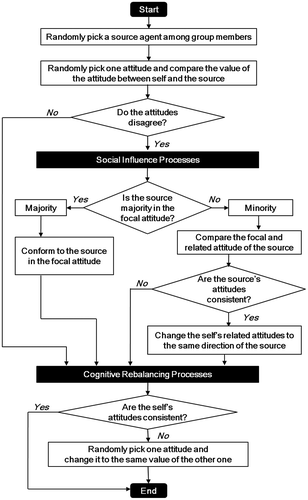
Figure 3. A workflow diagram portraying out attitude updating algorithm including majority and minority influences and a cognitive rebalancing process.

Table 1. The model parameters used in our simulation, the values used in the main exposition, and the ranges of the parameters we swept.

Figure 4. Results of base runs showing typical system patterns and characteristics at the individual and system level for the six combinations of majority and minority influence and cognitive rebalancing.
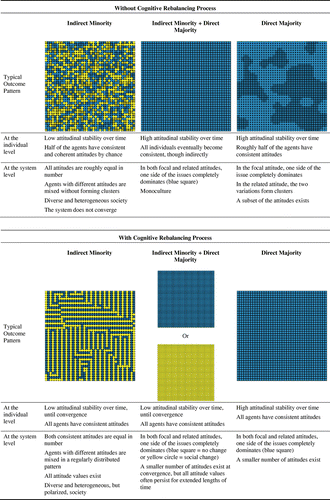
Note: These general summary results hold for model parameters sweeps as well.
Figure 4. Results of base runs showing typical system patterns and characteristics at the individual and system level for the six combinations of majority and minority influence and cognitive rebalancing.

Figure 5. Screenshots show the growth in popularity of the nascent attitude until the system becomes stochastically mixed at roughly equal proportions.
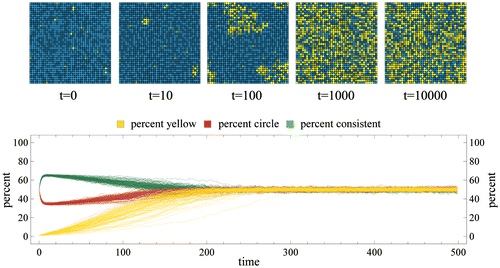
Notes: Though every run is distinct in its particular spatiotemporal arrangements, the dynamics are consistent. This plot of 100 runs is truncated to 500 iterations to highlight details of earlier periods.
Figure 5. Screenshots show the growth in popularity of the nascent attitude until the system becomes stochastically mixed at roughly equal proportions.

Figure 6. Screenshots from one run that achieved social change demonstrate the high volatility of the attitude change dynamics.
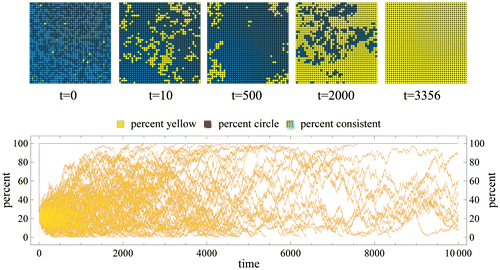
Note: The time series from 100 runs highlights this long-lasting volatile behavior and the prevalence of extended partial social change.
Figure 6. Screenshots from one run that achieved social change demonstrate the high volatility of the attitude change dynamics.

Figure 7. The points represent the proportion of runs that end with social change or with a population of at least half yellow agents at the 10,000 halting time aggregated over 500 runs.
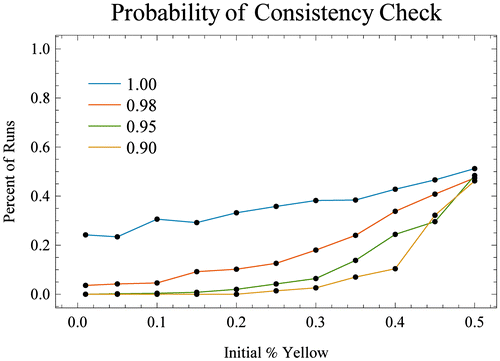
Figure 7. The points represent the proportion of runs that end with social change or with a population of at least half yellow agents at the 10,000 halting time aggregated over 500 runs.

Figure 8. This plot shows the proportion of yellow agents reached social change at the end of (left: binary social change measure) and that existed on average (right: continuous social change measure) for 500 runs when all three rules are activated.
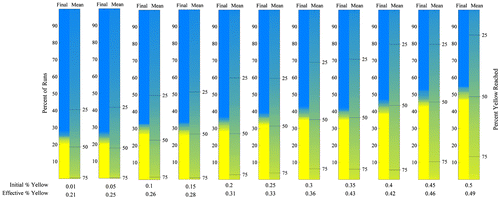
Note: There is a clearly increasing tendency to achieve social change with increasing initial percent holding the nascent idea.
Figure 8. This plot shows the proportion of yellow agents reached social change at the end of (left: binary social change measure) and that existed on average (right: continuous social change measure) for 500 runs when all three rules are activated.

Figure 9. The results of 500 runs with all three rules activated showing no difference in outcomes between random initial conditions vs. a community of adjacent initial yellow agents.
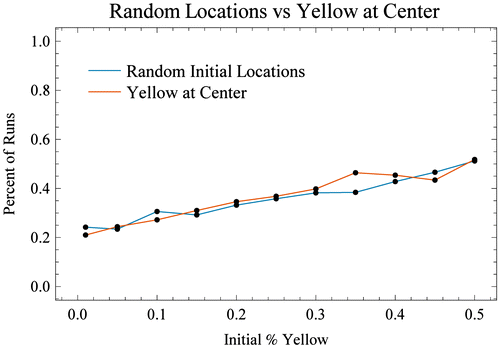
Figure 9. The results of 500 runs with all three rules activated showing no difference in outcomes between random initial conditions vs. a community of adjacent initial yellow agents.

Figure 10. Using the same parameters, but altering the topology to lattices of varying numbers of neighbors, we can see that the results are robust against ingroups of differing sizes and orientations.
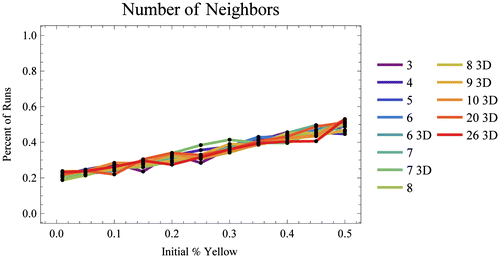
Note: The points represent the proportion of runs that end with social change or with a population of at least half yellow agents at the 10,000 halting time aggregated over 500 runs.
Figure 10. Using the same parameters, but altering the topology to lattices of varying numbers of neighbors, we can see that the results are robust against ingroups of differing sizes and orientations.

Figure 11. Biases in favor in retaining either previously held vs. newly acquired attitudes affect the indirect minority influence on social change.
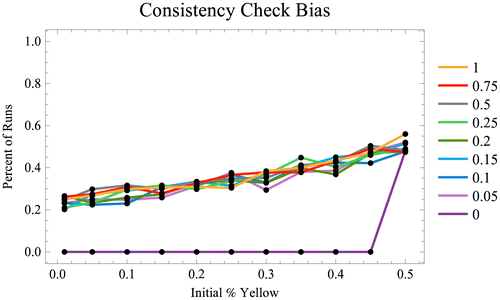
Notes: A value of .5 mean no bias (default model) and a value of 0 means that the agents always become consistent by changing any newly acquired attribute to match any previously held attributes. The points represent the proportion of runs that end with social change or with a population of at least half yellow agents at the 10,000 halting time aggregated over 500 runs.
Figure 11. Biases in favor in retaining either previously held vs. newly acquired attitudes affect the indirect minority influence on social change.

Figure 12. Decreasing the probability (and hence rate) of minority influence events reduces the incidence of social influence.
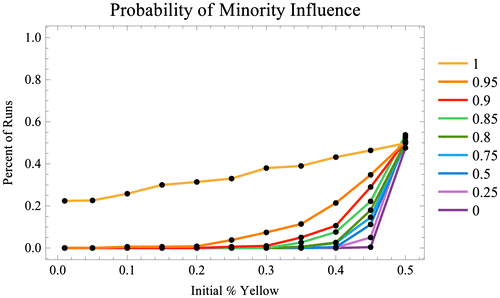
Note: The points represent the proportion of runs that end with social change or with a population of at least half yellow agents at the 10,000 halting time aggregated over 500 runs.
Figure 12. Decreasing the probability (and hence rate) of minority influence events reduces the incidence of social influence.
Reprints and Corporate Permissions

Please note: Selecting permissions does not provide access to the full text of the article, please see our help page How do I view content?

To request a reprint or corporate permissions for this article, please click on the relevant link below:

Academic Permissions

Please note: Selecting permissions does not provide access to the full text of the article, please see our help page How do I view content?

Obtain permissions instantly via Rightslink by clicking on the button below:

If you are unable to obtain permissions via Rightslink, please complete and submit this Permissions form. For more information, please visit our Permissions help page.