
Figures & data
Table 1. Descriptives and Pearson’s correlations among the variables (N = 214).
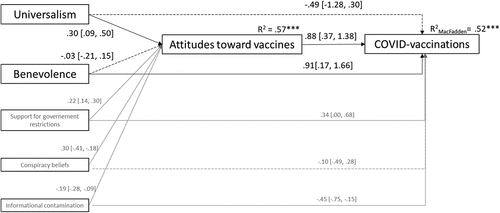
Figure 1. Model delineating the relationships among the variables of interest.
Note. Universalism indirect effect = .26 [.06, .67]; Benevolence indirect effect = -.02 [-.26, .13];
Unstandardized regression coefficients are reported out of parentheses and 95% CI derived from bootstrap resample among parentheses. Regression coefficients of X and covariates on Y, as well as indirect effects, are on a log-odds metric.
Data availability statement
The data that support the findings of this study are available from the corresponding author (MP) upon reasonable request.