215
Views
2
CrossRef citations to date
0
Altmetric
Original Articles

Influence of Coastal Proximity on Evapotranspiration Rates and Crop Coefficients of Maine Lowbush Blueberry (Vaccinium angustifolium)

, , &
Pages 323-343 | Published online: 09 Dec 2009

Figures & data

TABLE 1 Site Characteristics of Seven Maine Lowbush Blueberry Study Sites

TABLE 2 Selected May Through August Weather Variables at Four Study Sites of Varying Distance to the Maine Coast

TABLE 3 Mean Monthly ETo Rates (cm/week) at Varying Distances to the Maine Coast (2005–2008)Footnote z

FIGURE 1 Monthly frequency distribution of fog (visibility <1 km) hours at three Maine lowbush blueberry sites (visibility data not available for Deblois during the 2006 growing season).
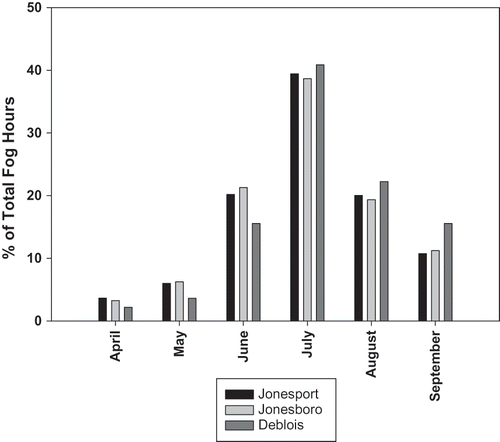
FIGURE 1 Monthly frequency distribution of fog (visibility <1 km) hours at three Maine lowbush blueberry sites (visibility data not available for Deblois during the 2006 growing season).

TABLE 4 Percentage of Fog and Mist Hours at Three Blueberry Fields of Varying Distance to the Maine Coast (2005–2008)

FIGURE 2 Water equivalent contributed to weighing lysimeters during episodes of fog (visibility <1 km). (Water equivalent was not calculated for the Deblois research station for the 2005–2006 growing seasons due to insufficient precipitation (2005) and visibility (2006) data.)
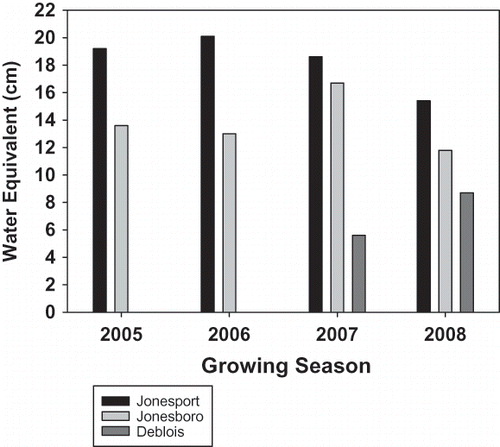
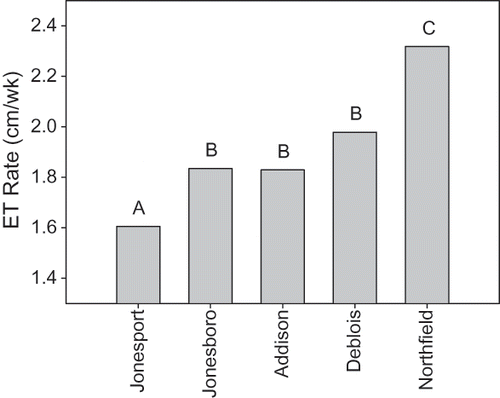
FIGURE 2 Water equivalent contributed to weighing lysimeters during episodes of fog (visibility <1 km). (Water equivalent was not calculated for the Deblois research station for the 2005–2006 growing seasons due to insufficient precipitation (2005) and visibility (2006) data.)
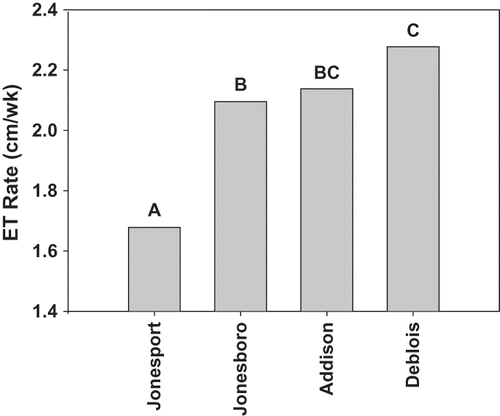
TABLE 5 Mean Monthly Actual ET Rates (cm/week) at Varying Distances to the Maine Coast (2005–2008)

FIGURE 3 Overall mean actual weekly ET rates for lowbush blueberry at five Maine field sites for 84 “days in common” during the period of May through August, 2008.

FIGURE 3 Overall mean actual weekly ET rates for lowbush blueberry at five Maine field sites for 84 “days in common” during the period of May through August, 2008.

FIGURE 4 Overall mean actual weekly ET rates for lowbush blueberry at five Maine field sites for 138 “days in common” during the period of May through August, 2006–2008.

FIGURE 4 Overall mean actual weekly ET rates for lowbush blueberry at five Maine field sites for 138 “days in common” during the period of May through August, 2006–2008.

Reprints and Corporate Permissions

Please note: Selecting permissions does not provide access to the full text of the article, please see our help page How do I view content?

To request a reprint or corporate permissions for this article, please click on the relevant link below:

Academic Permissions

Please note: Selecting permissions does not provide access to the full text of the article, please see our help page How do I view content?

Obtain permissions instantly via Rightslink by clicking on the button below:

If you are unable to obtain permissions via Rightslink, please complete and submit this Permissions form. For more information, please visit our Permissions help page.