Figures & data
TABLE 1 Formulation of Fruit Juices Studied Supplemented with Artichoke Concentrate
TABLE 2 Formulation of Fruit Jams Studied Supplemented with Artichoke Pulp
FIGURE 1 Measured pH of the different juices (top) and jams (bottom) studied according to storage time: before storage, after 30 days, and after 60 days.
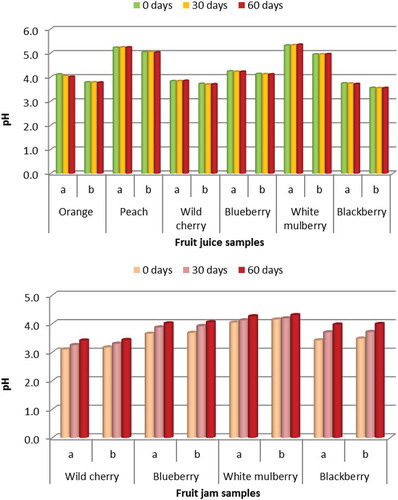
FIGURE 2 Measured refractometry index of the different juices (top) and jams (bottom) studied according to storage time: before storage, after 30 days, and after 60 days.
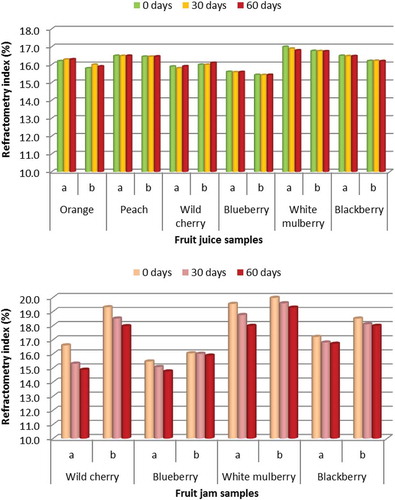
FIGURE 3 Measured total sugars content of the different juices (top) and jams (bottom) studied according to storage time: before storage, after 30 days, and after 60 days.
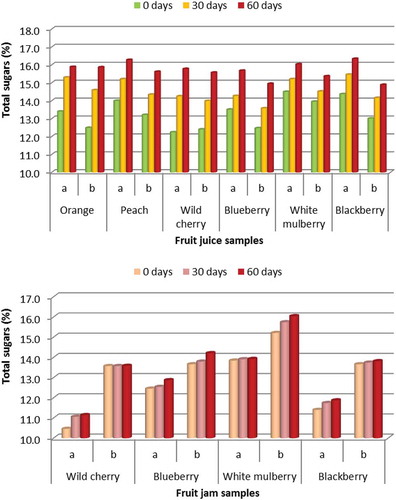
FIGURE 4 Measured reducing sugars content of the different juices (top) and jams (bottom) studied according to storage time: before storage, after 30 days, and after 60 days.
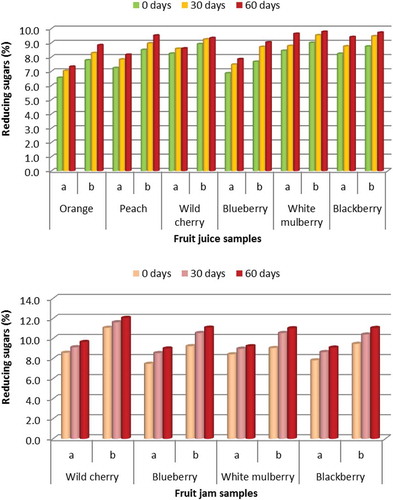
TABLE 3 Quantified Amount of Inulin in the Fruit Juices and Jams before and after Storage
FIGURE 5 Measured sucrose content of the different juices (top) and jams (bottom) studied according to storage time: before storage, after 30 days, and after 60 days.
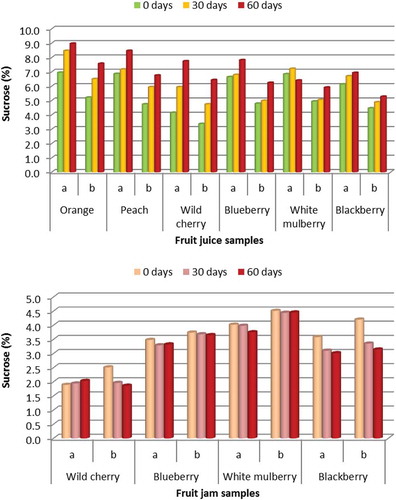
FIGURE 6 Measured fructose content of the different juices (top) and jams (bottom) studied according to storage time: before storage, after 30 days, and after 60 days.
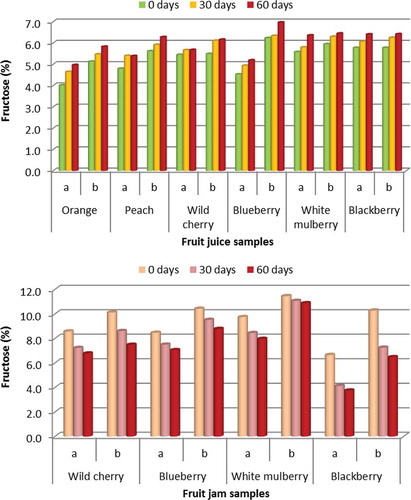
FIGURE 7 Measured glucose content of the different juices (top) and jams (bottom) studied according to storage time: before storage, after 30 days, and after 60 days.
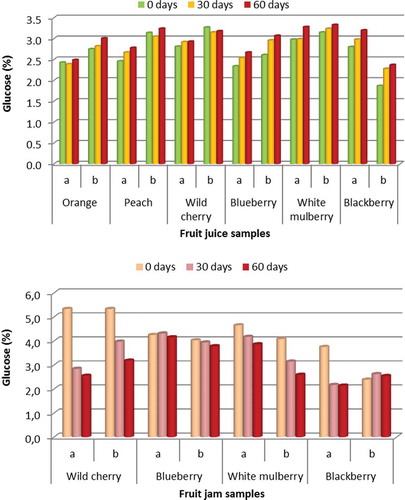
FIGURE 8 Sensorial characteristics of the juices studied: (A) orange, (B) peach, (C) wild cherry, (D) blueberry, (E) white mulberry, and (F) blackberry.
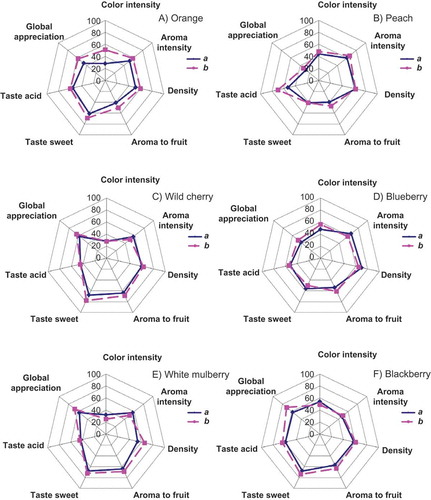
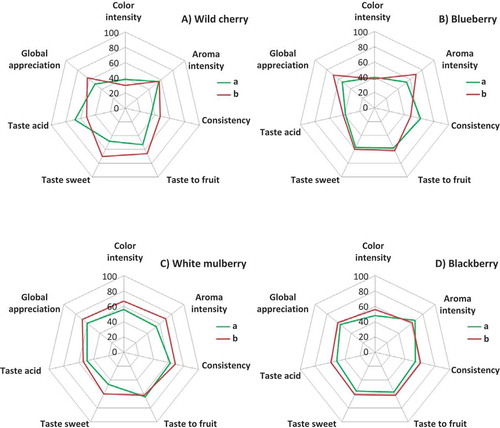
FIGURE 9 Sensorial characteristics of jams studied: (A) wild cherry, (B) blueberry, (C) white mulberry, and (D) blackberry.