Figures & data
Figure 1. Microscopic images (at 40×) of four life stages of O. surinamensis.
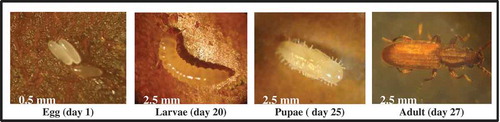
Table 1. Histogram and Textural Extracted Features from X-ray Images.
Figure 2. Segmentation of date images for features extraction.
Figure 3. X-ray images of two dates infested with O. surinamensis at different life stages. Sample 1: infestation could not be visually recognized; Sample 2: feeding area was recognizable by dark spots (in red circles).
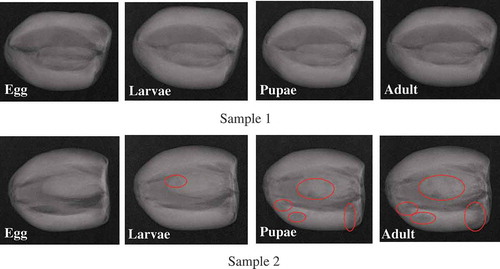
Figure 4. X-ray images of a wheat kernel infested by different life stages of R. dominica (Karunakaran et al., Citation2004a) and date infested by different life stages of O. surinamensis.
Figure 5. The size of the O. surinamensis compared to the size of the date sample (insect is inside red circle).
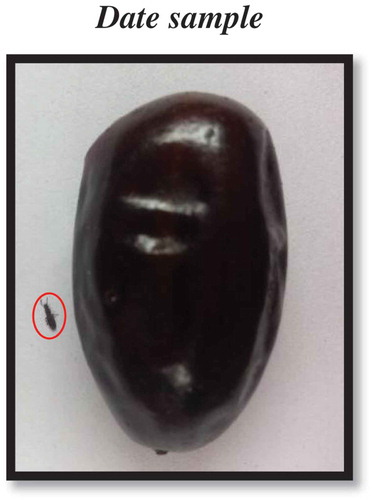
Figure 6. Mean gray value of un-infested and infested dates with O. surinamensis (α = 0.05, n = 16). The letters above the bars indicate significant differences between the means of the categories. Bars with the same letter are not significantly different.
Table 2. Discrimination Accuracies (%) of Un-infested and Infested Dates in Four Classes Model.
Table 3. Discrimination Accuracies (%) of Un-infested and Infested Dates in Two Classes Model.
Figure 7. X-ray image for skin delamination and dark cavity that affect the classification accuracies of un-infested and infested dates.
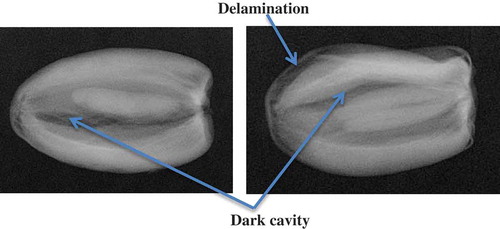
Figure 8. Pairwise classification for un-infested and infested dates with all O. surinamensis life stages (n = 16) with LDA.
Figure 9. Pairwise classification for un-infested and infested dates with all O. surinamensis life stages (n = 100) using bootstrapping with LDA.
Figure 10. X-ray images of dates with natural existence of skin delamination and its appearance on the X-ray images.
Figure 11. X-ray images of dates with non-uniform internal cavity: (a) large cavity and (b) small cavity.
Figure 12. X-ray images of dates with different size of seeds.