Figures & data
Table 1. Name and origin of evaluated Pyrus genotypes and cultivars.
Table 2. List of the primers used in RAPD analysis, their sequences, band scored (BS), no. of polymorphism band (NPB), percent of polymorphism (PP), no. of different allels (Na), expected heterozygosity of the marker (He), Shannon’s information index (I), and polymorphic information content of the markers (PIC).
Table 3. Analysis of molecular variance (AMOVA) among and within populations.
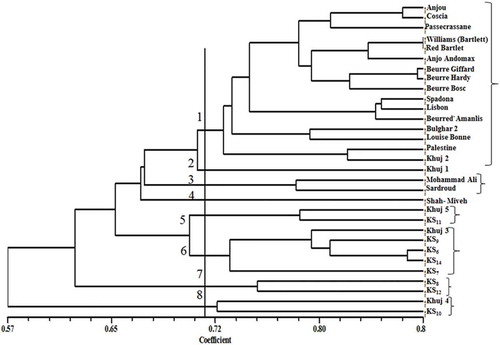
Figure 1. Dendrogram of 31 pear species, cultivars, and genotypes generated by UPGMA cluster analysis using the RAPD data based on Dice’s coefficient. (Source: Nei and Li, Citation1979.)