Figures & data
Table 1. Some physic-chemical properties of the soil used in the experiment.
Table 2. Analytical data for zinc-glycine chelate.
Table 3. Picked out IR bands (cm–1) of zinc-glycine [Zn(Gly)2] chelate.
Figure 1. The effects of Zn-Gly application and different soil Boron concentrations on electrolyte leakage in pistachio leaf. *Mean separation by THSD at P ≤ 0.05.
Figure 2. The effects of Zn-Gly application and different soil Boron concentrations on ascorbic acid content in pistachio leaf. *Mean separation by THSD at P ≤ 0.05.
Figure 3. The effects of Zn-Gly application and different soil Boron concentrations on (A) hydrogen peroxide (H2O2), (B) malondialdehyde (MDA), and (C) phenolics contents in pistachio leaf. *Mean separation by THSD at P ≤ 0.05.
Figure 4. The correlations between electrolyte leakage and concentration of malondialdehyde and H2O2 in pistachio leaf.
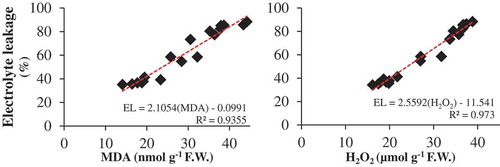
Figure 5. The effects of Zn-Gly application and different soil Boron concentrations on lypoxygenase (LOX) activity in pistachio leaf. *Mean separation by THSD at P ≤ 0.05.
Figure 6. The effects of Zn-Gly application and different soil Boron concentrations on (A) superoxide dismutase (SOD), (B) catalase (CAT), and (C) ascorbate peroxidase (APX) activity in pistachio leaf. *Mean separation by THSD at P ≤ 0.05.