Figures & data
Table 1. Summary of analysis of variance (ANOVA) for survivability, plant height, shoot diameter, leaf area, dry weights of root and shoot of citrus rootstocks after 90 days of irrigation with different levels of water salinity.
Figure 1. Relationship between survivability and water salinity (A) and between plant height and water salinity (B) of citrus rootstocks after 90 days of irrigation with different levels of water salinity (R = Rootstocks, S = Water salinity, ** Significant at P< .01). Error bars on both axes represent standard error.
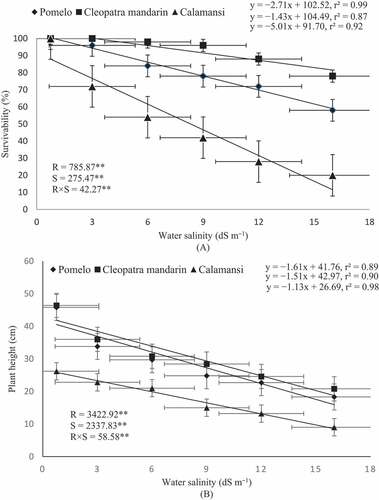
Figure 2. Relationship between shoot diameter and water salinity (A) and between leaf area and water salinity (B) of citrus rootstocks after 90 days of irrigation with different levels of water salinity (R = Rootstocks, S = Water salinity, ** Significant at P< .01). Error bars on both axes represent standard error.
Figure 3. Relationship between dry weight of root and water salinity (a) and between dry weight of shoot and water salinity (b) of citrus rootstocks after 90 days of irrigation with different levels of water salinity (R = Rootstocks, S = Water salinity, ** Significant at P< .01). Error bars on both axes represent standard error.
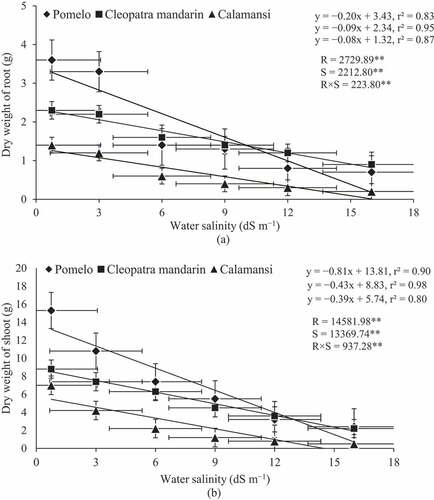
Table 2. Summary of analysis of variance (ANOVA) for Na, Cl, N, P, K, chlorophyll, and proline contents of citrus rootstocks after 90 days of irrigation with different levels of water salinity.
Figure 4. Relationship between Na content and water salinity (A) and between chloride content and water salinity (B) of citrus rootstocks after 90 days of irrigation with different levels of water salinity (R = Rootstocks, S = Water salinity, ** Significant at P< .01). Error bars on both axes represent standard error.
Figure 5. Relationship between amounts of nitrogen (N) and water salinity (a), phosphorous (P) and water salinity (b) and potassium (K) and water salinity (c) of citrus rootstocks after 90 days of irrigation with different levels of water salinity (R = Rootstocks, S = Water salinity, ** Significant at P< .01). Error bars on both axes represent standard error.
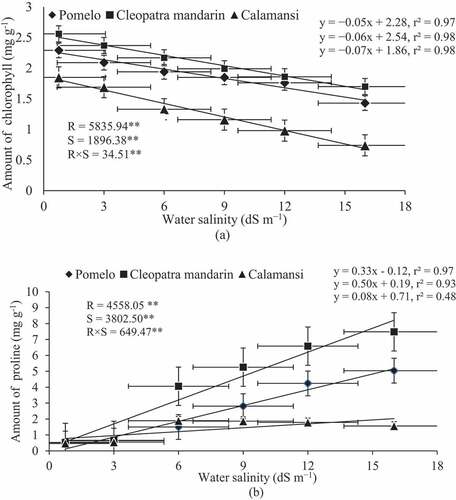
Figure 6. Relationship between amount of chlorophyll and water salinity (a) and between amount of proline and water salinity (b) of citrus rootstocks after 90 days of irrigation with different levels of water salinity (R = Rootstocks, S = Water salinity, ** Significant at P< .01). Error bars on both axes represent standard error.