
Figures & data
Table 1. Cultivars names and their geographical origins
Table 2. Harvest time and monthly meteorological data from August to early September 2017 in Northern Morocco, Meknes (Ain-Taoujdate experimental station-INRA)
Table 3. Morphological traits of fig cultivars (Mean ± SD)
Figure 1. Box and whisker plot of fig skin chromatic coordinates of studied cultivars (L*: lightness; c*: Chroma; h°: Hue angle). Breval B: ’Breval Blanca’; CDB: ‘Cuello Dama Blanca’; EQL PS20: ‘El Quoti Lbied PS20ʹ; White A: ‘White Adriatic’
Figure 2. Content levels of individual sugars (g.kg−1dw) in whole fruit of 11fig cultivars. Average values ± standard deviation are presented statistically significant differences (p < .05) among cultivars are presented over error bars (a-j). Box and whisker plots were used to show the distribution of adata set
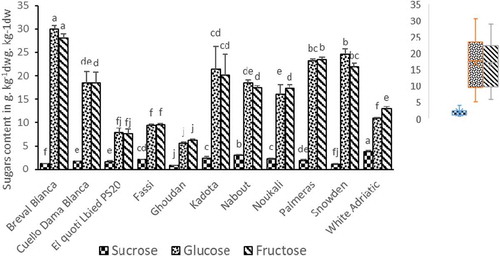
Figure 3. Organic acids content (g kg−1) of the whole fruits in 11 fig cultivars. Average values ± standard deviation are presented statistically significant differences (P < .05) among cultivars are presented over error bars (a-f). Box and whisker plots were used to show the distribution of adata set
Figure 4. Loading plot and score plot after principal component analysis of the variables and individuals in the plane by two first principal components ((PC1 and PC2) with atotal variance of 56.14%). Each group was presented in different colors
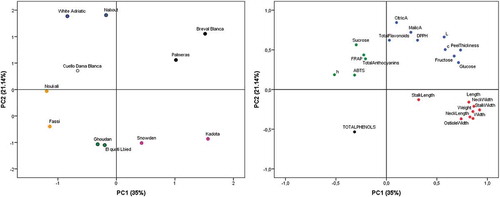
Table 4. Phenolic compounds (Total phenols, flavonoids, anthocyanins, and total proanthocyanidins) of studied cultivars
Table 5. Free radical scavenging activity (DPPH and ABTS) and ferric reducing ability (FRAP) (mean ±SE in mmol TE/g dw) of studied cultivars
Table 6. Analysis of variance (Wilk’s test) and canonical correlations of biochemical components and morphological traits. The highest ones are in bold
Table 7. Canonical variates and related statistics