
Figures & data
Table 1. Box-Behnken experimental design matrix and mean values of all responses of untreated samples and samples treated under different experimental conditions after 14 d of storage at 5°C
Table 2. Statistical parameters of RSM analysis of response variables
Figure 1. Response surface for microbiological quality of strawberry juice. Variation of yeast and molds (a) and psychrophilic bacteria (b) with ultrasound time and geraniol concentration at 180 μg/mL of pomegranate extract
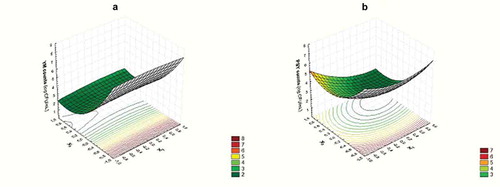
Figure 2. Response surface curves for nutritional quality of strawberry juice. (a): Variation of DPPH with ultrasound time and pomegranate extract concentration at 0.15 uL/mL of geraniol. (b): Variation of DPPH with ultrasound time and geraniol concentration at 180 ug/mL of pomegranate extract. (c): Variation of TPC with ultrasound time and pomegranate extract concentration at 0.15 uL/mL of geraniol. (d): Variation of TPC with ultrasound time and geraniol concentration at 180 ug/mL of pomegranate extract
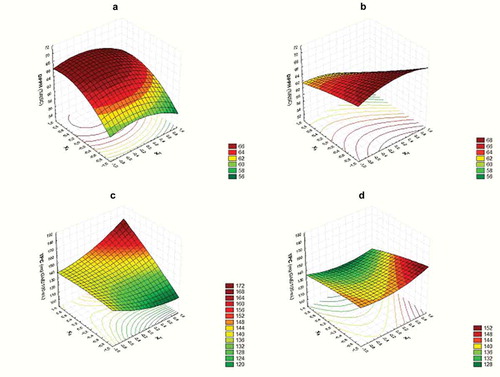
Figure 3. Response surface curves for sensory quality of strawberry juice. Variation of citric odor (a) and off-odor (b) with ultrasound time and geraniol concentration at 180 μg/mL of pomegranate extract
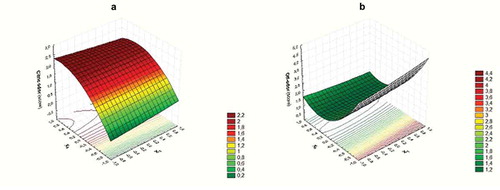
Figure 4. Response surface plots showing the combined effect of pomegranate extract concentration and ultrasound time (a), geraniol concentration and ultrasound time (b), and geraniol and pomegranate extract concentration (c) on the Desirability function with other variables constant at middle level
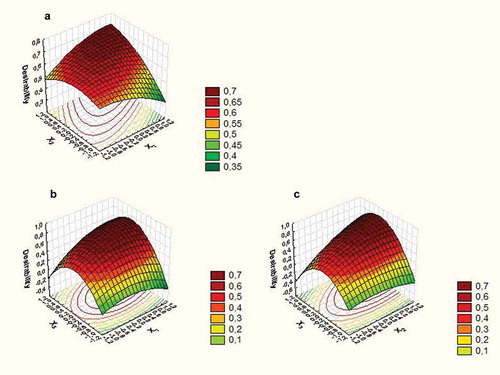
Table 3. Validation results
Table 4. Counts of inoculated Escherichia coli O157:H7 (log CFU/mL) in control and treated strawberry juice stored at 5°C