
Figures & data
Figure 1. Physical locations of nine IStraw90 Axiom® array SNP markers in octoploid reference genome sequence (cv. Camarosa). The FaRXf1 genomic region (598 kb) is marked in the chromosome Fvb6–2, and subgenome-specific SNPs are highlighted in gray
Table 1. List of the IStraw90 Axiom® array probes and sequences for FaRXf1 mapped to the reference genome ‘Camarosa’. The forward and reverse primer for each SNP probe are underlined. ‘Camarosa’ Chromosome 6–2 subgenome-specific SNPs are highlighted in gray
Figure 2. HRM analysis of HRM6D_33.083 marker and two subgenome-specific markers, Xf1HRM-8073 and Xf1HRM-8263, associated with FaRXf1 using CTAB purified DNA. (A) HRM analysis result of HRM6D_33.083 marker with 384 breeding accessions in the 2017 HTP-MAS program; (B) and (C) HRM analysis results of Xf1HRM-8073 (B) and Xf1HRM-8263 (C) markers with 14 accessions (K08-17, K12-10, 13.77–5, 13.78–157, 14.100–58, 14.100–59, 14.101–154, 14.101–200, 14.101–225, ‘Florida Brilliance’, ‘Florida Radiance’, ‘Strawberry Festival’, Sweet Sensation® ‘Florida127ʹ, and ‘Treasure’). The blue and green curves indicate resistance and red curve indicates susceptibility
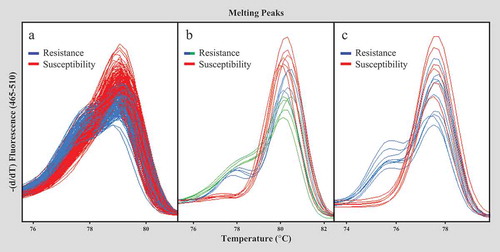
Table 2. Subgenome specific-marker validation of Xf1HRM-8073 and Xf1HRM-8263 markers in five varieties and 51 UF advanced accessions using CTAB purified DNA and NaOH crude extracts