
Figures & data
Table 1. Effects of blossom thinning treatments on ‘Alberta’ peach fruit set, weight, size and yield in 2015–2016a
Table 2. Effects of blossom thinning treatments on ‘Alberta’ peach yield in 2015 and 2016a
Table 3. Effects of blossom thinning treatments on ‘Alberta’ peach soluble solids, total acidity, TSS/TA and fruit color in 2015–2016a
Table 4. Effects of blossom thinning treatments on ‘Sun King’ nectarine fruit set, weight, size and yield in 2015–2016a
Figure 1. Change in fruit size of nectarine “Sun King” for various treatments as a function of time in 2015–2016
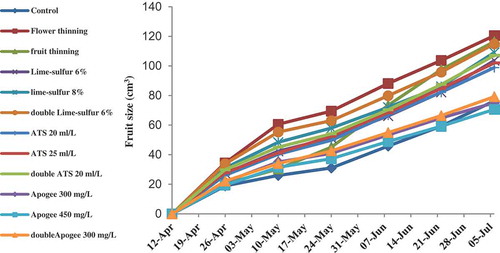
Figure 2. Change in fruit weight of nectarine “Sun King” for various treatments as a function of time in 2015–2016
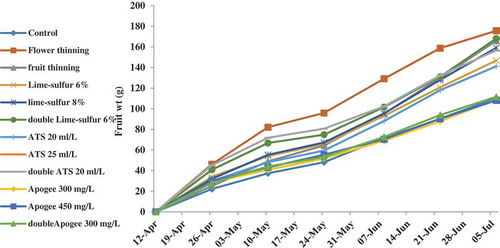
Figure 3. Change in fruit size of peach “Alberta” for various treatments as a function of time in 2015–2016
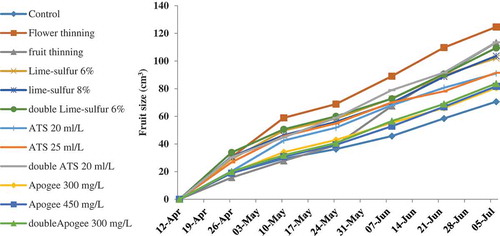
Figure 4. Change in fruit weight of peach “Alberta” for various treatments as a function of time in 2015–2016
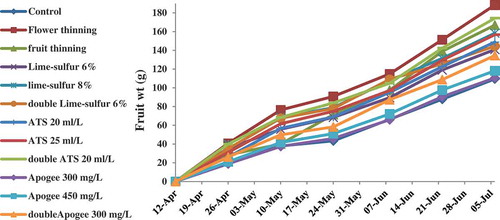
Table 5. Effects of blossom thinning treatments on ‘Sun King’ nectarine yield in 2015 and 2016a
Table 6. Effects of blossom thinning treatments on ‘Sun King’ nectarine soluble solids, total acidity, TSS/TA and Fruit Color in 2015–2016a