Figures & data
Table 1. List of grapevine accessions analyzed in the present study
Figure 1. Schematic map of Iran with collection sites for 25 grapevine accessions from Qazvin province. This map was produced using the ggplot2 package in R environment
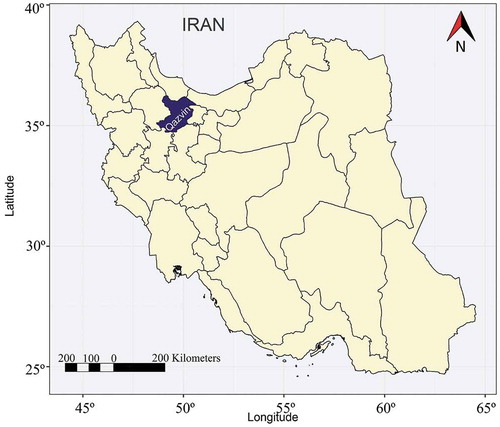
Table 2. Information on microsatellite loci of the grapevine accessions used in this study including marker name, primer sequences, annealing temperature, and allele size range
Figure 2. Polyacrylamide gel profile of amplified product from 25 grapevine accessions using VVS1- and VVDM25-specific primers based on . L: Molecular ladder SMO313. The length of marker fragments is in base pairs (bp)
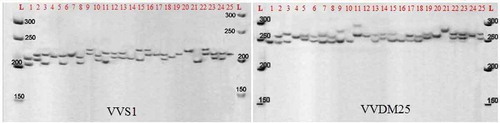
Table 3. Summary of marker data revealed by fourteen microsatellite loci in 25 grapevine accessions collected from Iran
Figure 3. Distribution of allele frequencies for the loci of fourteen microsatellite markers studied to characterize 25 grapevine accessions. In each graph, horizontal axis represents the allele size (bp) for each microsatellite marker and vertical axis represents the observed allele frequency
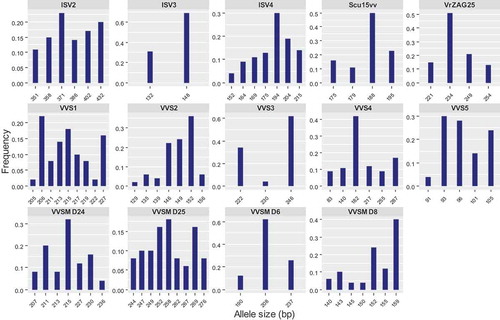
Figure 4. Cluster diagram for 25 grapevine accessions using microsatellite marker data based on Jaccard’s similarity coefficient and UPGMA algorithm
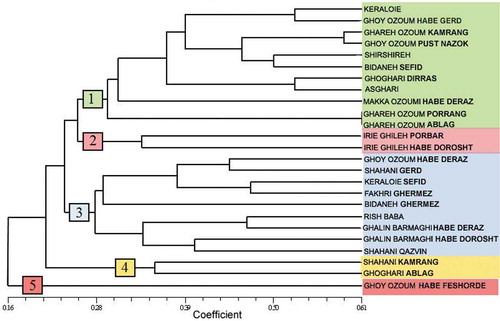
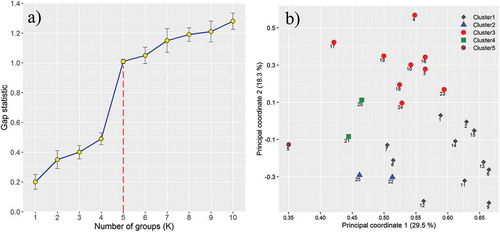
Figure 5. Grouping of grapevine accessions. (a) The gap statistic plot showed the optimal number of clusters. (b) Two-dimensional diagram plotted from principal coordinates analysis based on Jaccard’s distance matrix for genetic relationships of 25 grapevine accessions using microsatellites polymorphism data. The numbers at the front of any shape indicate the accession number. The color of the shapes indicates the five different groups identified through the UPGMA clustering