Figures & data
Table 1. Primary coconut products and by-products in the Philippines
Table 2. Major Philippine exports and destination countries, 2016
Table 3. Share of agriculture production, 2016 (value at constant 2000 price)
Figure 1. Philippines’ total exports by product, 2008–2013 (Food and Agriculture Organization, Citation2018)
Table 4. Percentage distribution of production by region, the Philippines, 2016
Table 5. Coconut production in the Philippines in 2001–2015
Table 6. Annual coconut yield in 2003–2008
Figure 2. Trends in coconut product exports in the Philippines, 1961–2017 (FAO, Citation2018)
Table 7. Philippine exports: volume and value by major country of destination, 2016
Figure 3. Marketing channels of coconut products in the Philippines (Clarete and Roumasset, Citation1983)
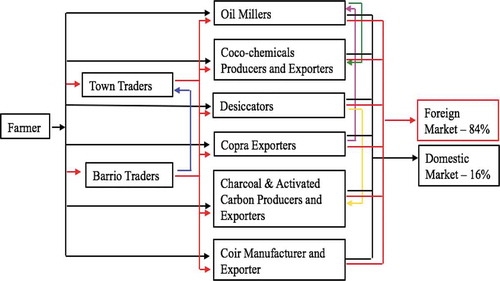
Figure 4. Marketing channels of copra and coconut oil in the Philippines
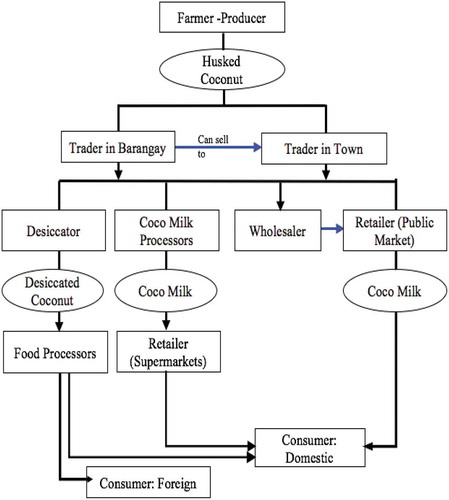
Figure 5. Marketing channels of husked coconuts in the Philippines