Figures & data
Figure 1. Flow Chart for Multi-target Preservation Technology for Pineapple (1–8 samples were taken for analysis at different processing stages)
![Figure 1. Flow Chart for Multi-target Preservation Technology for Pineapple (1–8 samples were taken for analysis at different processing stages)](/cms/asset/feb78983-c947-4c32-bb1f-f47b3e314887/wsfr_a_1755411_f0001_b.gif)
Figure 2. The water activity (Lane 1), total flavonoids (mg catechin equivalents/100 g, Lane 2), total phenolics (mg gallic acid equivalents/100 g, Lane 3), β-carotene (mg/100 g, Lane 4), vitamin C (mg/100 g, Lane 5), and moisture (%, Lane 6) contents of multi-target preserved pineapple (mean of three varieties Mauritius, Kew, and Queen) for fresh pineapple (Sample 4), after boiling in sugar syrup (Sample 5), after adding potassium meta bisulfate (Sample 6), after osmosis (Sample 7) & cooled sample before packaging (Sample 8). Mean values ± standard deviation with small letters (a-d) for differences between samples are significantly different (P < .05) as measured by Duncan’s Multiple Range Test (DMRT)
![Figure 2. The water activity (Lane 1), total flavonoids (mg catechin equivalents/100 g, Lane 2), total phenolics (mg gallic acid equivalents/100 g, Lane 3), β-carotene (mg/100 g, Lane 4), vitamin C (mg/100 g, Lane 5), and moisture (%, Lane 6) contents of multi-target preserved pineapple (mean of three varieties Mauritius, Kew, and Queen) for fresh pineapple (Sample 4), after boiling in sugar syrup (Sample 5), after adding potassium meta bisulfate (Sample 6), after osmosis (Sample 7) & cooled sample before packaging (Sample 8). Mean values ± standard deviation with small letters (a-d) for differences between samples are significantly different (P < .05) as measured by Duncan’s Multiple Range Test (DMRT)](/cms/asset/292adf74-811b-4731-812a-c84568183aec/wsfr_a_1755411_f0002_b.gif)
Table 1. Bromelain, polyphenol, and flavonoid contents of different parts of pineapple
Figure 3. The water activity (Lane 1), total flavonoids (mg catechin equivalents/100 g, Lane 2), total phenolics (mg gallic acid equivalents/100 g, Lane 3), β-carotene (mg/100 g, Lane 4), vitamin C (mg/100 g, Lane 5), moisture (%, Lane 6) contents of multi-target preserved pineapple (mean of three varieties Mauritius, Kew, and Queen) stored for different periods of time. Mean values ± standard deviation with small letters (a-d) for differences between storage periods are significantly different (P < .05) as measured by Duncan’s Multiple Range Test (DMRT)
![Figure 3. The water activity (Lane 1), total flavonoids (mg catechin equivalents/100 g, Lane 2), total phenolics (mg gallic acid equivalents/100 g, Lane 3), β-carotene (mg/100 g, Lane 4), vitamin C (mg/100 g, Lane 5), moisture (%, Lane 6) contents of multi-target preserved pineapple (mean of three varieties Mauritius, Kew, and Queen) stored for different periods of time. Mean values ± standard deviation with small letters (a-d) for differences between storage periods are significantly different (P < .05) as measured by Duncan’s Multiple Range Test (DMRT)](/cms/asset/1469431c-c626-47c4-b810-2a7efdaceac4/wsfr_a_1755411_f0003_b.gif)
Figure 4. Sensory profile analysis of fresh (□, solid line) and multi-target preserved pineapple after 2 months of storage (Δ, dotted line)
![Figure 4. Sensory profile analysis of fresh (□, solid line) and multi-target preserved pineapple after 2 months of storage (Δ, dotted line)](/cms/asset/b84e55a1-de73-4cf9-9edb-8bcf69fb3191/wsfr_a_1755411_f0004_oc.jpg)
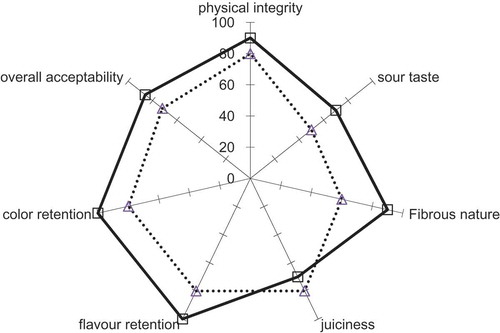
Table 2. Capital investment of pineapple processing plant