
Figures & data
Table 1. Strawberry sensory attributes, descriptions, and reference standards developed by trained panelists through descriptive analysis
Table 2. Sensory intensity scores and acceptability scores of appearance attributes before tasting fresh strawberries from 10 cultivars grown in Maryland
Figure 1. Skin of a fresh strawberry compared with the skin of a strawberry that has dehydrated in storage, becomes wrinkled, and lost glossiness
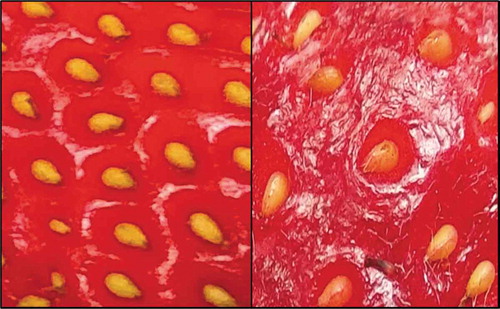
Table 3. Instrumental exterior color values for 10 strawberry cultivars grown in Maryland
Table 4. Size measurements from image analyses (n = 20), compared with sensory-panel acceptability scores of the berry size of 10 strawberry cultivars grown in Maryland
Table 5. Analyses of variance for size measurements from image analyses (n = 20) of berries from 10 strawberry cultivars grown in Maryland
Table 6. Sensory intensity scores of the attributes for flavor for berries from 10 strawberry cultivars grown in Maryland
Table 7. Soluble solids contents (SSC), initial pH, and titratable acidity (TA) values for each of 10 strawberry cultivars grown in Maryland. Sensory intensity scores of the attributes for flavor (sweetness, sourness)
Table 8. Instrumental estimates of berry texture using a texture analyzer (Model TA. XT Plus, Stable Microsystems, Surrey, England), compared with sensory-panel intensity scores of the attributes for texture for berries of 10 strawberry cultivars grown in Maryland
Table 9. Means of sensory acceptability scores for the attributes for overall appearance, texture, flavor, quality, and aroma of fresh strawberries from 10 cultivars grown in Maryland