Figures & data
Table 1. Details of C. canephora germplasm collections used in the study
Table 2. Details of data generated by screening C. canephora germplasm using SRAP primer pairs
Figure 1. The DNA amplification pattern of 58 Coffea canephora germplasm accession screened using SRAP (ME11+ EM13) primer Lane L: 1Kb+ DNA Ladder, Lanes 1 to 58: Confirms to R1 to R58 canephora accessions
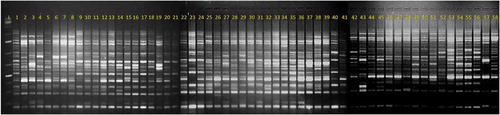
Figure 2. Jaccard’s similarity index based dendrogram generated using SRAP assay depicting the relationships among the 58 Coffea canephora germplasm accessions
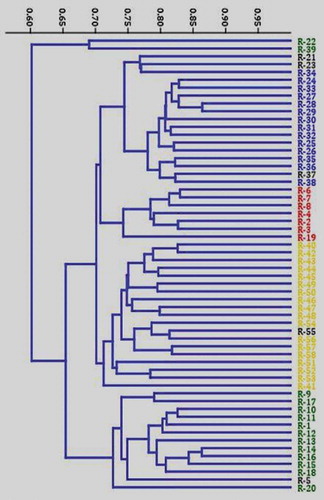
Table 3. Details of data generated by screening C. canephora germplasm using SCoT primers
Figure 3. The DNA amplification pattern of 58 Coffea canephora germplasm accession screened using SCoT 29 primer Lane L: 1Kb+ DNA Ladder, Lanes 1 to 58: Confirms to R1 to R58 canephora accessions
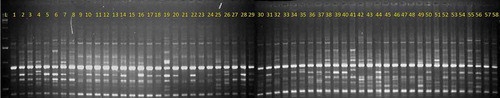
Figure 4. Jaccard’s similarity index based dendrogram generated using SCoT assay depicting the relationships among the 58 Coffea canephora germplasm accessions
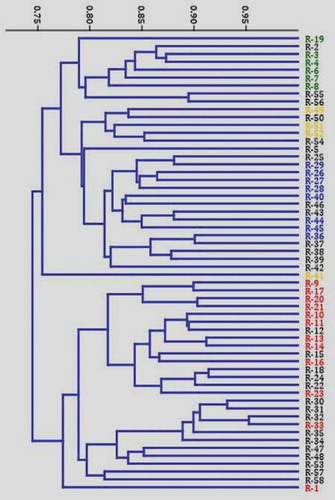
Figure 5. Dendrogram showing the relationships among the 58 Coffea canephora germplasm accession analyzed using combined SRAP and SCoT data based on Jaccard’s similarity index
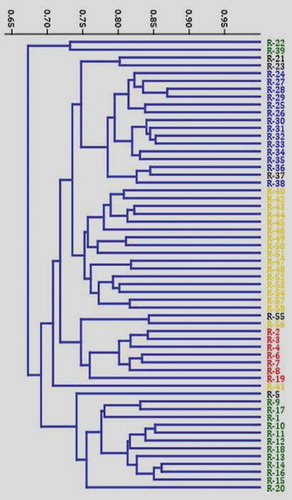
Figure 6. Population structure of 58 Coffea canephora germplasm accession based on SRAP assay at K = 4. Each color represent one subpopulation (A1 = Red bars, A2 = Green bars, A3 = Blue bars and A4 = Yellow bars)
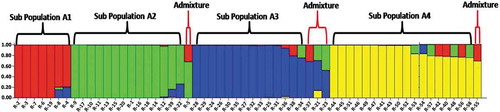
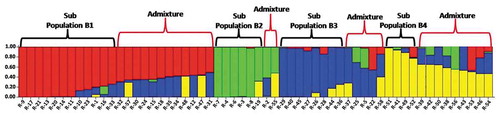
Figure 7. Population structure of 58 Coffea canephora germplasm accession based on SCoT assay at K = 4. Each color represent one subpopulation (B1 = Red bars, B2 = Green bars, B3 = Blue bars and B4 = Yellow bars)