
Figures & data
Table 1. Oxygen (O2), carbon dioxide (CO2) values, and observations of chestnuts packaged and the control during storage
Figure 1. Visual appearance of packaged (PE – polyethylene; VAC – vacuum; MAP – modified atmosphere packaging) and control chestnuts throughout storage
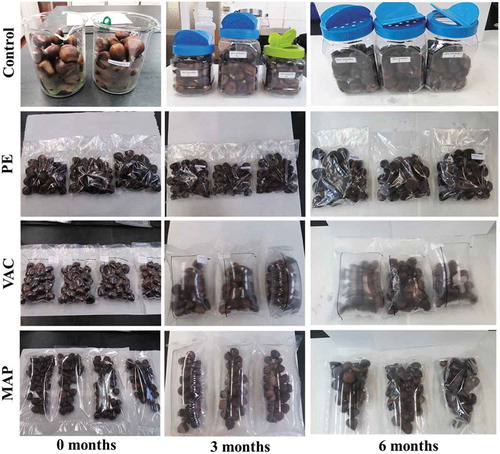
Table 2. Changes in the color of shell and inside chestnuts packaged and the control throughout storage
Figure 2. Moisture content and water activity (aw) of packaged and control chestnuts throughout storage
Figure 3. Titratable acidity and total soluble solids values determined on packaged and control chestnuts along their storage
Table 3. Texture parameters of chestnuts packaged and the control throughout storage
Table 4. Microbial counts in chestnuts packaged in PE, VAC, and MAP and control throughout storage (log CFU/g ± standard deviation)