
Figures & data
Figure 1. Water-sensitive paper cards are placed in vertical and horizontal positions at the top and mid-tier of the canopy, respectively. The active side of card is oriented away from the sprayer or downward toward the bed (i.e. hard-to-reach areas of the canopy).
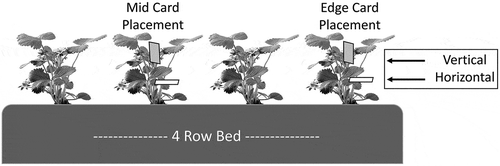
Figure 2. Evaluation trial map. Four water-sensitive paper cards are placed at five locations along each bed. In the depicted scenario, a spray rig would travel up bed 1, then down bed 9 and again for bed 17 and 25. Each bed is considered a replication.
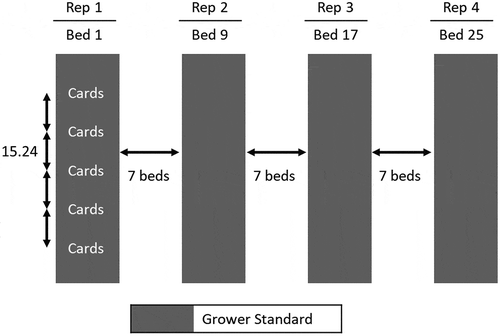
Figure 3. Sample image of four water-sensitive paper cards (right) and their respective binary image (left) side by side. Boarders of card images have been cropped to minimize artifacts. Images are labeled MV, EV, MH, and EH to indicate their plant row location and card orientation: middle, edge, horizontal, and vertical. Program calculated coverage is shown above each image.
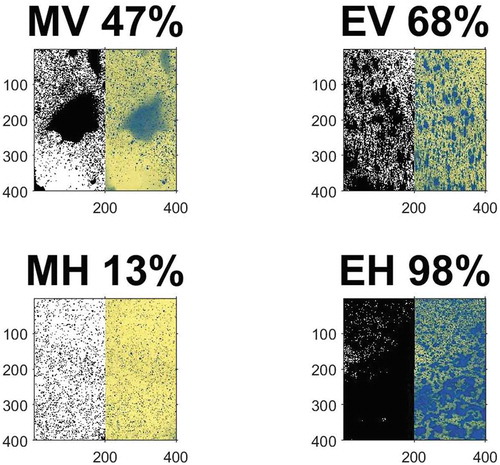
Table 1. Spray rigs used in the study classified by their working conditions. It should be noted that plant rows of 4 and 2 per bed indicate a bed width of 162, 172 cm, 120 cm, and 132 cm, respectively. a denotes Santa Maria, b denotes Oxnard, and c denotes Watsonville.
Figure 4. Evaluation percent coverages of rigs 1 through 21. The error bars indicate 1 standard deviation. Wind speeds were within 10 km/h of each other for each evaluation. All plant canopies were at a similar growth stage.
Table 2. Summary of Means (Fisher’s LSD)* of Spray Rig Coverage. *Means that do not share the same letter are significantly different p ≤ 0.05.