Figures & data
Figure 1. The distribution of the total monthly rainfall during the year in Mudurnu district (means of 2017 and 2018 years)
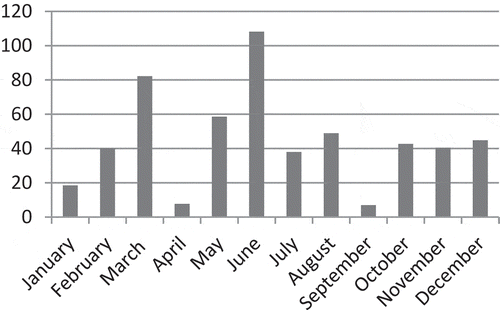
Figure 2. The average monthly temperature distribution during the year in Mudurnu district (means of 2017 and 2018 years)
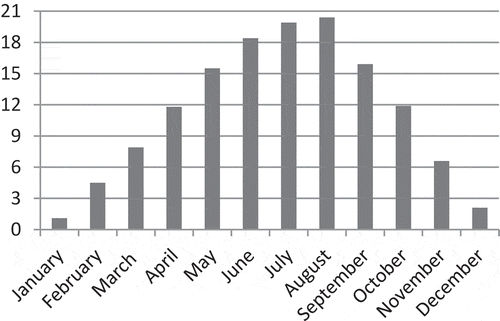
Table 1. Gallic acid, protocatechuic acid, catechin, chlorogenic acid, vanillic acid, and syringic acid levels of red currant fruits (Red Lake) harvested at four maturity stages (mg 100 g−1)
Table 2. Gallic acid, protocatechuic acid, catechin, chlorogenic acid, vanillic acid, and syringic acid levels of red currant fruits (Red Lake) harvested at four maturity stages (mg 100 g−1)
Table 3. P-Coumaric acid, ferulic acid, o-Coumaric, rutin, phloridzin, and quercetin levels of red currant fruits (Red Lake) harvested at four maturity stages (mg 100 g−1)
Table 4. P-Coumaric acid, ferulic acid, o-Coumaric, rutin, phloridzin, and quercetin levels of red currant fruits (Red Lake) harvested at four maturity stages (mg 100 g−1)
Table 5. Oxalic, citric, tartaric, malic, succinic, fumaric acid (g kg−1), and ascorbic acid (mg 100 g−1) levels of red currant fruits (Red Lake) harvested at four maturity stages
Table 6. Oxalic, citric, tartaric, malic, succinic, fumaric acid (g kg−1), and ascorbic acid (mg 100 g−1) levels of red currant fruits (Red Lake) harvested at four maturity stages
Figure 3. Correlation between different ripening periods and phenolic compounds distributions of Redlake fruits
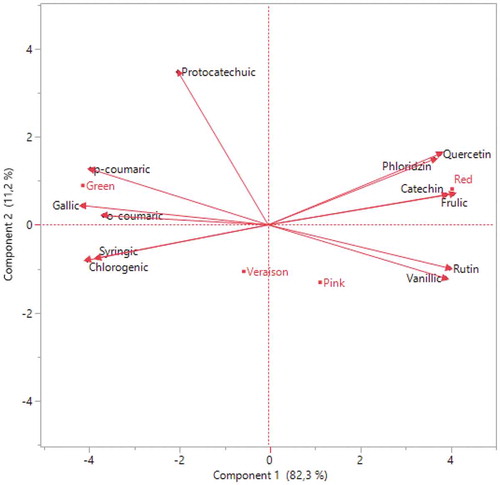
Figure 4. Correlation between different ripening periods and phenolic compounds distributions of Rovada fruits
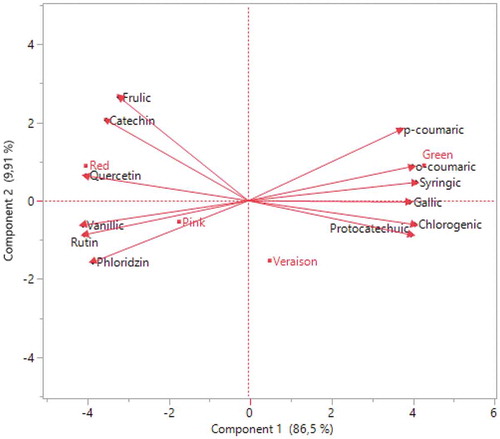
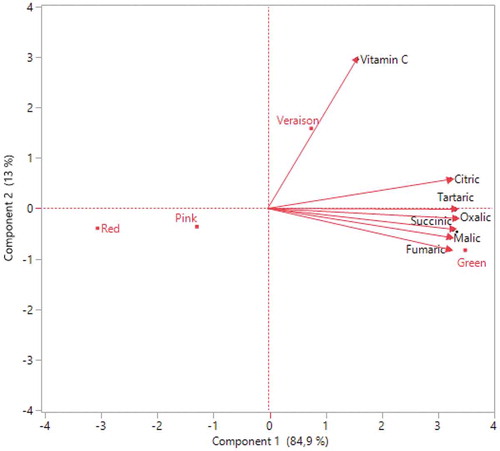
Figure 5. Correlation between different ripening periods and organic acid distributions of Redlake fruits
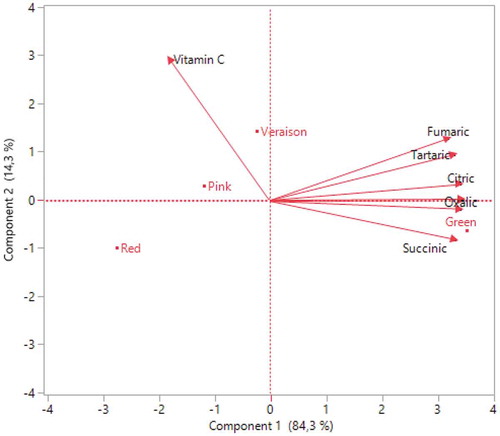
Figure 6. Correlation between different ripening periods and organic acid distributions of Rovada fruits