
Figures & data
Table 1. Physio-chemical fruit quality of orange as affected by tree age and harvesting season
Figure 1. Interaction effect of tree age and harvest season on fruit rag, TSS and peel thickness (a-c 2017), (d-f 2018), A = young B = moderate, C = older trees, HS = harvesting season, O = October, D = December
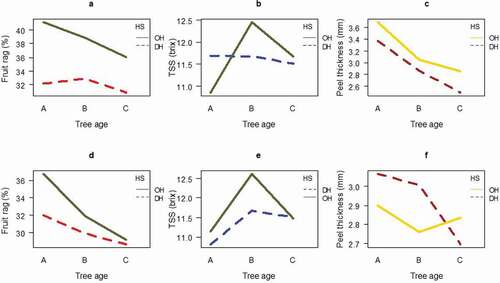
Figure 2. Tree age (A-C) and harvest season (HS) in October (O) and December (D) interaction effect on juice content and fruit mass (2017a, 2018b), TSS and maturity index (2017 c, 2018d, A = young, B = moderate, C = old tree ages
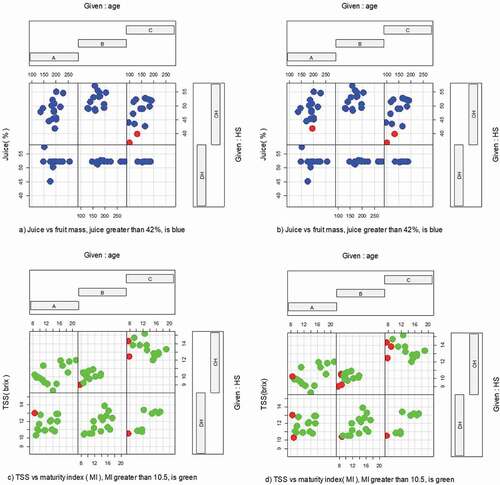
Figure 3. Tree age effect on sugar content (%), values are average of triplicate measurements (mean ± SD), A = young, B = moderate, C = old tree ages
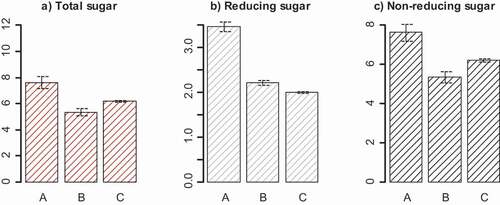
Table 2. DPPH activity EC50, total phenolic and Vitamin C contents of orange affected by tree age
Figure 4. DPPH radical scavenging activity (a), Ferric reducing power (mg of ascorbic acid per gram of juice) (b) and total antioxidant capacity of orange juice at different concentrations using phosphomolybdenum method butylated hydroxytoluene equivalent (mg BHTE g−1), (c) from different tree ages (GA1 = young, GA2 = moderate and GA3 = old, trees age). Values are average of triplicate measurements (mean ±SD)
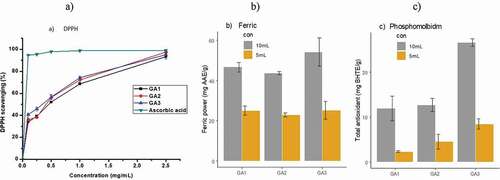
Table 3. Correlations between antioxidant activities assays on total phenolic and vitamin C content