
Figures & data
Figure 1. Measurement of the ripening period of banana using the epicarp color and number of days after exposure to different local induced ripening techniques of (a) Musa acuminata and (b) Musa balbisiana.
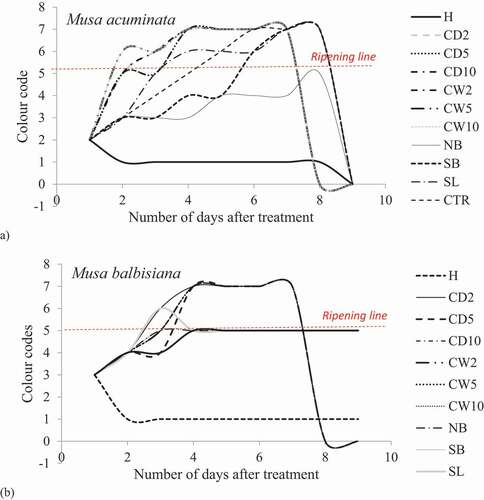
Figure 2. Musa acuminata at 3 days after exposure to different local induced ripening treatments
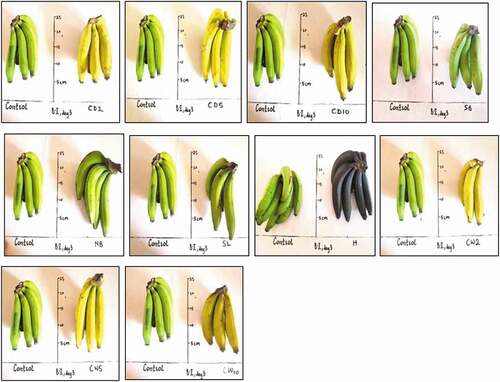
Figure 3. Musa balbisiana at 3 days after exposure to different local induced ripening treatments
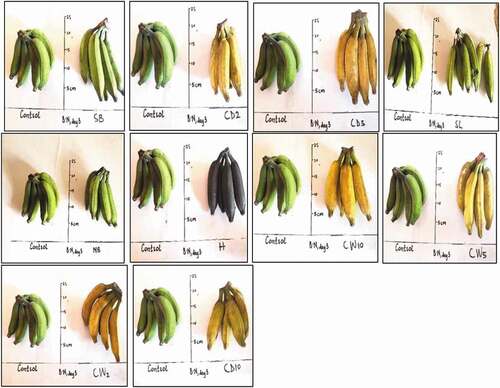
Figure 4. Musa acuminata at 7 days after exposure to different local induced ripening treatments
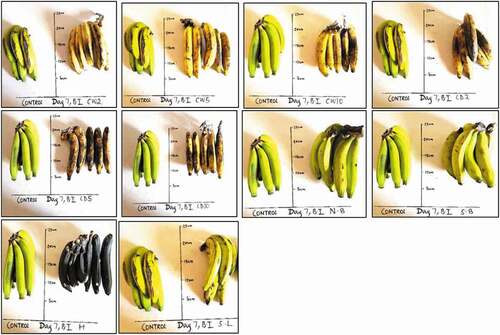
Figure 5. Musa balbisiana at 7 days after exposure to different induced local ripening treatments
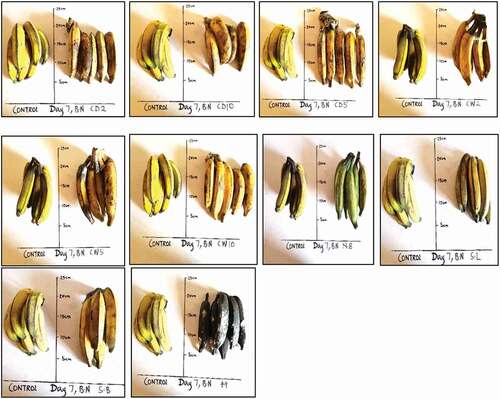
Figure 6. (a) Musa acuminata and (b) Musa balbisiana at 9 days after exposure to different local induced ripening treatments
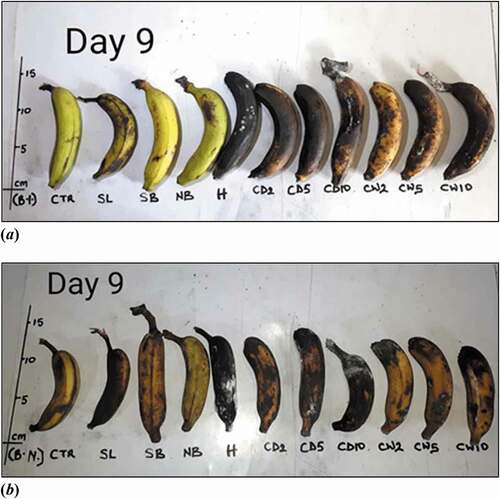
Table 1. Number of days and degree of softness of the fruits after exposure to the experimental treatments
Table 2. Number of days and the degree of spoilage observed in the fruits after treatment with different local induced ripening conditions
Table 3. Total phenols content of banana after exposure to different local induced ripening conditions
Table 4. The ascorbic acid content of banana after exposure to different local induced ripening conditions
Table 5. Total sugar concentration in banana after exposure to the experimental conditions
Table 6. Arsenic concentration in fruit endocarp after exposure to different calcium carbide concentration to induce ripening