
Figures & data
Table 1. The analysis of variance of salinity and salicylic acid on the measured parameters in guava
Figure 1. The interaction of salicylic acid and NaCl on POD (A) and SOD (B) activities in guava seedlings. Means ± SD of six replicates are given. The same letters indicate no statistically significant difference (Tukey, p < .01)
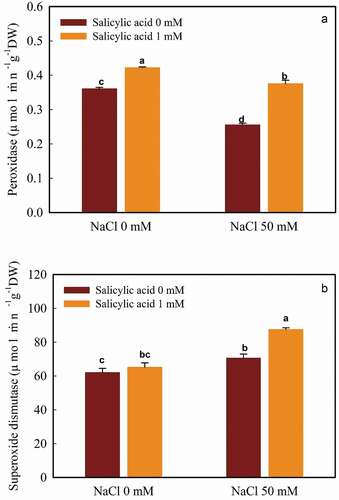
Figure 2. The interaction of salicylic acid and NaCl on the FRAP (A) and DPPH (B) capacity in guava seedlings. Means ± SD of six replicates are given. The same letters indicate no statistically significant difference (Tukey, p < .01)
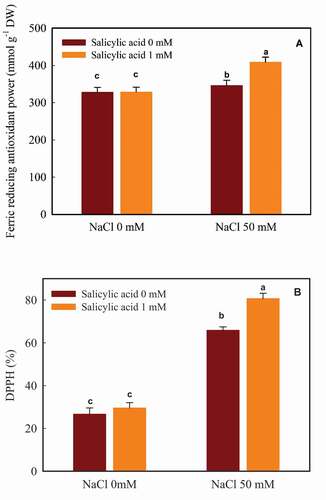
Figure 3. The interaction of salicylic acid and NaCl on TFC (A) and TPC (B) in guava seedlings. Means ± SD of six replicates are given. The same letters indicate no statistically significant difference (Tukey, p < .01)
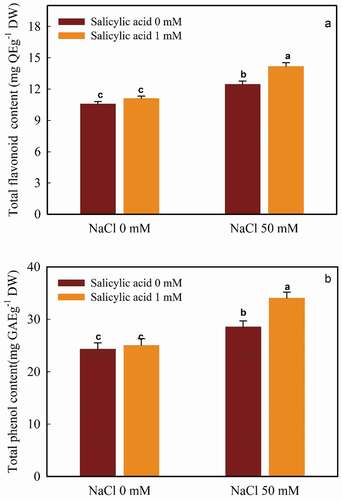
Table 2. The correlation analysis of guava physiological parameters