Figures & data
Table 1. Estahban Meteorological data in the 3 experimental years
Figure 1. Pruning methods, a. Traditional pruning (Arrows indicate the location of pruned one-year lateral branches). b. Green pruning (The arrow indicates the location of the green pruning.). c. Limb heading back pruning (Arrows indicate the location of pruned limbs.). d. Trunk thinning out pruning (Arrows indicate the location of pruned trunkTSs.)
![Figure 1. Pruning methods, a. Traditional pruning (Arrows indicate the location of pruned one-year lateral branches). b. Green pruning (The arrow indicates the location of the green pruning.). c. Limb heading back pruning (Arrows indicate the location of pruned limbs.). d. Trunk thinning out pruning (Arrows indicate the location of pruned trunkTSs.)](/cms/asset/e2f1609f-b22c-492f-8277-f493cbf422c8/wsfr_a_1892011_f0001_oc.jpg)
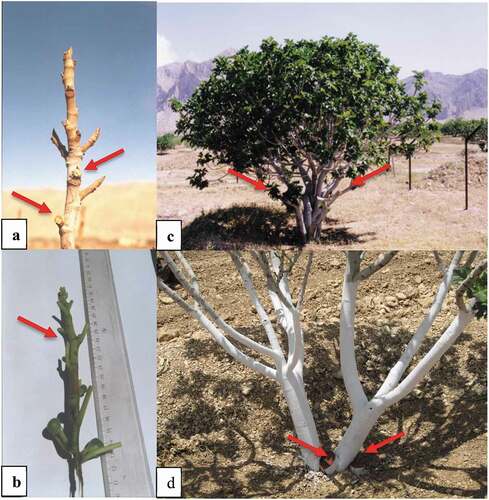
Table 2. Details of evaluted attributes in the current study
Table 3. Effects of different severe pruning on the criteria for tolerance level measuring to drought (leaf water potential and temperature) and vegetative (leaf and shoot) characteristics of fig (Sabz cultivar) tree under rainfed conditions
Figure 2. The changes of leaves area per tree in C (
![](/cms/asset/f1e84675-76cc-4104-af70-19fefe5f6eb3/wsfr_a_1892011_ilg0002.gif)
![](/cms/asset/a13ee061-0ccc-4eed-bc9b-4241f2aff4d4/wsfr_a_1892011_ilg0003.gif)
![](/cms/asset/31ffb542-3cf5-4368-a0c3-a5b38f284046/wsfr_a_1892011_ilg0004.gif)
![](/cms/asset/7a67b5c7-b4c2-4c50-b937-85e687b68003/wsfr_a_1892011_ilg0005.gif)
![](/cms/asset/1a6842b4-2650-4a4d-816d-3055f9e2f8b0/wsfr_a_1892011_ilg0006.gif)
![](/cms/asset/a8a36725-2ca9-4599-96a5-92c21c86b7ef/wsfr_a_1892011_ilg0007.gif)
![](/cms/asset/76666594-75f1-474e-8bfd-3e46a1697140/wsfr_a_1892011_ilg0008.gif)
![Figure 2. The changes of leaves area per tree in C (Display full size), G (Display full size), H (Display full size), HG (Display full size), T (Display full size), TG (Display full size), TH (Display full size), and THG (Display full size) treatment during 3 years experiment](/cms/asset/3ee85f74-24ce-4a3a-bfcf-b8b2ea3142ef/wsfr_a_1892011_f0002_b.gif)
Figure 3. The percentage changes of leaf abscission in C (
![](/cms/asset/fd34ac66-5386-454e-b4a7-9542087dbf04/wsfr_a_1892011_ilg0010.gif)
![](/cms/asset/0e779d73-a118-4581-bf70-eaa48e1826bd/wsfr_a_1892011_ilg0011.gif)
![](/cms/asset/d0c30de1-df14-4a01-95b5-28c0e8ae3958/wsfr_a_1892011_ilg0012.gif)
![](/cms/asset/1893e5b5-3de2-4d7f-aabe-70f7d4dbf4a5/wsfr_a_1892011_ilg0013.gif)
![](/cms/asset/26ebf63d-e340-4e7c-86b7-936eca416ccd/wsfr_a_1892011_ilg0014.gif)
![](/cms/asset/2d25af8f-f604-473e-a56b-5747923b07e5/wsfr_a_1892011_ilg0015.gif)
![](/cms/asset/7c4be8f0-f12d-4e21-882c-f68fcd740cd7/wsfr_a_1892011_ilg0016.gif)
![Figure 3. The percentage changes of leaf abscission in C (Display full size), G (Display full size), H (Display full size), HG (Display full size), T (Display full size), TG (Display full size), TH (Display full size), and THG (Display full size) treatment from July until December period](/cms/asset/18b89860-41cb-48da-b576-0eecb0b81256/wsfr_a_1892011_f0003_b.gif)
Figure 4. The changes of shoot number per tree in C (
![](/cms/asset/0137deda-1547-41d9-8517-a3948bf86e2a/wsfr_a_1892011_ilg0018.gif)
![](/cms/asset/2e74c1d3-12cf-4dd5-b397-d060ab5140cf/wsfr_a_1892011_ilg0019.gif)
![](/cms/asset/c5957e33-68c8-47b2-be1e-34cf284c9ff1/wsfr_a_1892011_ilg0020.gif)
![](/cms/asset/ef083459-6938-431c-befb-5788015c2d07/wsfr_a_1892011_ilg0021.gif)
![](/cms/asset/1324b44b-f1ad-472e-9731-7c6aa2ebac4b/wsfr_a_1892011_ilg0022.gif)
![](/cms/asset/38ea4b6f-33db-457d-8d8f-46d9688046a3/wsfr_a_1892011_ilg0023.gif)
![](/cms/asset/f4980780-11cc-451a-a7c7-e8673dff914f/wsfr_a_1892011_ilg0024.gif)
![Figure 4. The changes of shoot number per tree in C (Display full size), G (Display full size), H (Display full size), HG (Display full size), T (Display full size), TG (Display full size), TH (Display full size), and THG (Display full size) treatment during 3 years experiment](/cms/asset/1efa62e5-202e-4de6-9056-d51e2e20bc32/wsfr_a_1892011_f0004_b.gif)
Table 4. Effects of different treatments of severe pruning on syconium characteristics and fruit biochemical properties of Sabz cultivar fig under rainfed conditions
Figure 5. The changes of syconia number per tree in C (
![](/cms/asset/b0e07dc8-9692-46b5-9f4b-298a61895a53/wsfr_a_1892011_ilg0026.gif)
![](/cms/asset/cfd7a15d-59c6-4db6-949f-a4fb2321d905/wsfr_a_1892011_ilg0027.gif)
![](/cms/asset/e3110831-c6dd-4384-9913-d753070183a8/wsfr_a_1892011_ilg0028.gif)
![](/cms/asset/7cda7f5c-4260-45f5-a381-31b08f849665/wsfr_a_1892011_ilg0029.gif)
![](/cms/asset/97033883-e6cd-4753-a5c2-8d082ccbfb76/wsfr_a_1892011_ilg0030.gif)
![](/cms/asset/5115a49f-c918-4a2a-a93d-3ca698a50477/wsfr_a_1892011_ilg0031.gif)
![](/cms/asset/1da3849c-116f-4e57-a554-bc9e91c58a23/wsfr_a_1892011_ilg0032.gif)
![Figure 5. The changes of syconia number per tree in C (Display full size), G (Display full size), H (Display full size), HG (Display full size), T (Display full size), TG (Display full size), TH (Display full size), and THG (Display full size) treatment during 3 years experiment](/cms/asset/72626edf-c2cb-45f8-8ccd-c231a090bea7/wsfr_a_1892011_f0005_b.gif)
Table 5. Effects of different severe pruning treatments on fruit ripe time of Sabz cultivar fig under rainfed conditions
Table 6. Effects of various pruning treatments on commercial quality of dried figs (Sabz cultivar) tree under rainfed conditions
Table 7. Effects of different severe pruning treatments on single dried fig weight and yield of Sabz cultivar under rainfed conditions