Figures & data
Figure 1. T. luteum subsp. flavovirens in its native habitat in south-eastern of Morocco
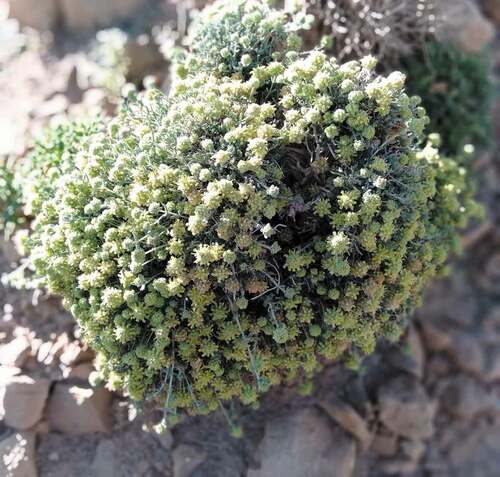
Table 1. Composition of the EO of T. luteum subsp. flavovirens from Southeast of Morocco
Figure 2. Chromatographic profile on apolar column (a) and polar column (b) of T. luteum subsp. flavovirens EO
Figure 3. Structures of the most abundant compounds identified in. T. luteum subsp. flavovirens EO
Table 2. Mycelial radial growth inhibition of Alternaria sp., P. expansum and R. stolonifer at various concentrations of T. luteum subsp. flavovirens EO in liquid and vapor-phase
Figure 4. Effect of the concentrations of T. luteum subsp. flavovirens EO in liquid phase on the mycelial radial growth of fungal isolates tested
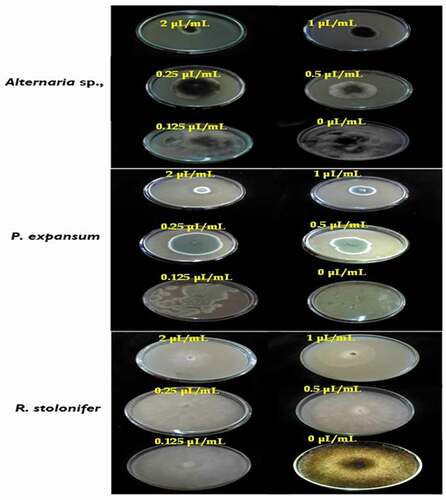
Figure 5. Effect of the concentrations of T. luteum subsp. flavovirens EO in vapor phase on the mycelial radial growth of fungal isolates tested
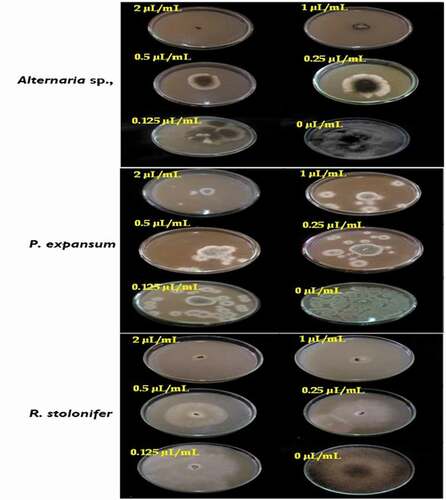
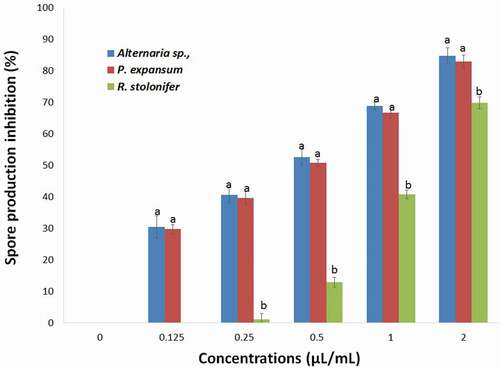
Figure 6. Effects of different concentrations of S T. luteum subsp. flavovirens EO in vapor phase on the spore production of the three fungal strains
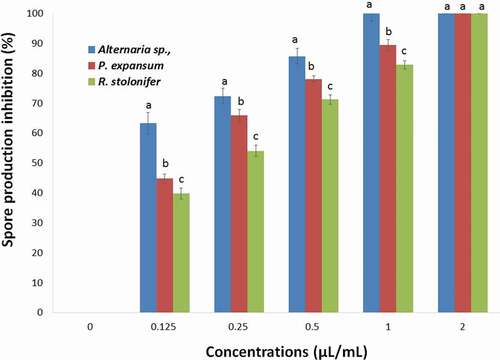
Figure 7. Effects of different concentrations of T. luteum subsp. flavovirens EO in liquid phase on the spore production of the three fungal strains