Figures & data
Table 1. 1Cx monoploid genome size (Mbp), ploidy level, the origin of the studied genotypes in European, Asian, and indigenous Iranian pears during 2017 growing season
Table 2. One-way ANOVA for genome size and morphological traits evaluated among 37 studied pear genotypes
Table 3. Mean values genome size and fruit characteristics of the studied pear genotypes
Table 4. Mean values leaf characteristics of the studied pear genotypes
Figure 1. The Silk Road map, which used to be the main route connecting Europe to East Asia through Iran. The lines on the map indicate the land and the sea or water route. Also, the tick dots indicate the countries of origin of the present studied pears
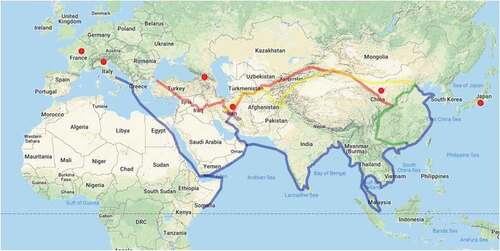
Figure 2. Flow cytometric histograms of 2Cx DNA content of 37 studied pear genotypes. The left peaks refer to G1 of pear samples and the right peaks refer to G1 of either G.m.: Glycine max cv. `Polanka’ (G12, G15, G17, G27, G28, G29, G32); Z.m.: Zea mays CE-777(G16); S.l.: Solanum lycopersicum cv. `Stupicke’ (other genotypes) as reference standards. Mean CV% of the peaks were less than 5%
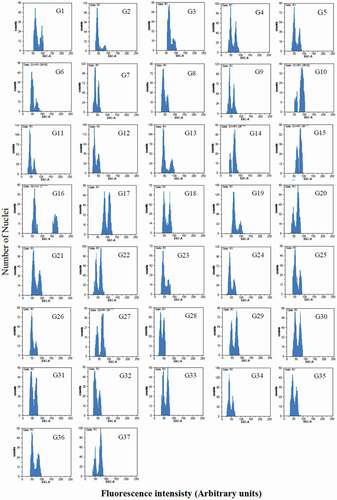
Figure 3. Principal component analysis (PCA) of the studied genotypes and cultivars of pear from European, Asian, and indigenous Iranians based on morphological traits and genome size. Each point represents one genotype and the green and blue lines are drawn to indicate the division of genotypes into two large groups
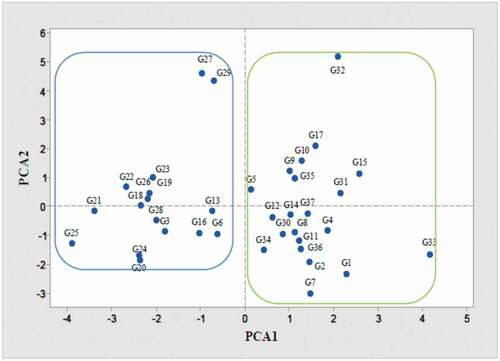
Figure 4. Ward cluster analysis of pear genotypes from European, Asian, and indigenous Iranian pears based on morphological traits and genome size. According to this cluster analysis, pears were divided into two main European (The left side of the figure) and Asian (The right side of the figure) groups
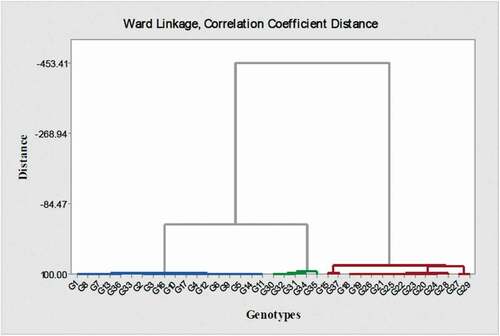
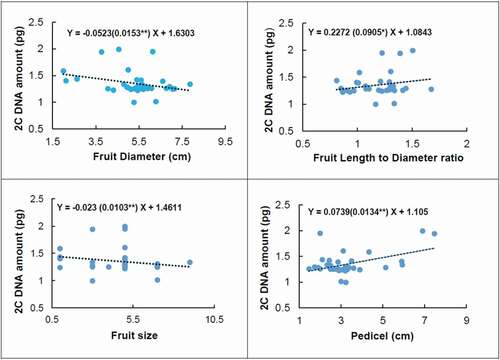
Figure 5. Linear regression between genome size (2Cx DNA) and fruit diameter, fruit size, fruit length to diameter ratio, and pedicel length of the studied European, Asian, and indigenous Iranian pear genotypes. The Pearson correlation coefficient between genome size and fruit diameter was −0.306**, fruit size −0.209*, fruit length to diameter ratio 0.217*, and pedicel 0.464**. *and**correlation is significant at P ≤ 0.05 and P ≤ 0.01 respectively