Figures & data
Table 1. Different fruit mass prediction models based on manual and image processing in literature
Table 2. Summary of the input output features used
Figure 1. Flow chart of preprocessing steps for image features extraction
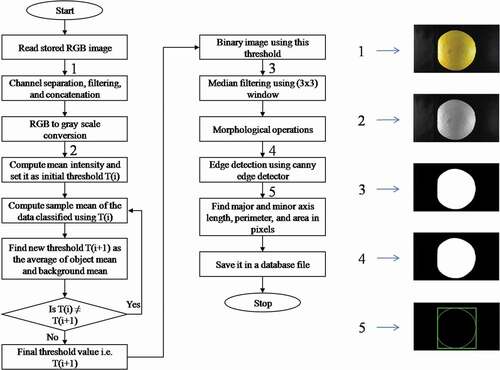
Figure 2. Methodology adopted for calibration and validation of the models
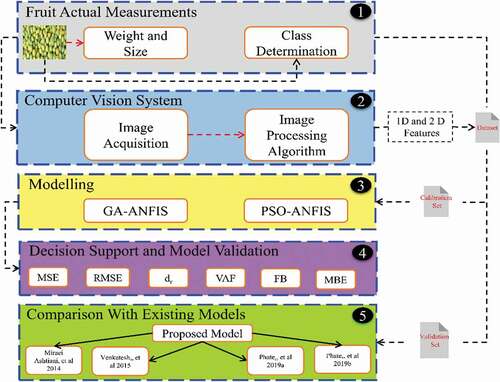
Figure 3. Schematic of SVM type 1 classifier
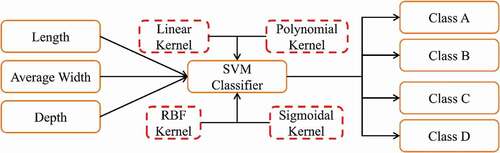
Figure 4. Schematic of GA optimized ANFIS model
Figure 5. Schematic of PSO optimized ANFIS model
Table 3. Confusion matrix for different SVM classifier and support vector (SV) count
Table 4. SVM classifier performance measure
Table 5. Analysis of population size and ranking of GA–ANFIS models
Figure 6. Performance of GA optimized ANFIS model for different population size
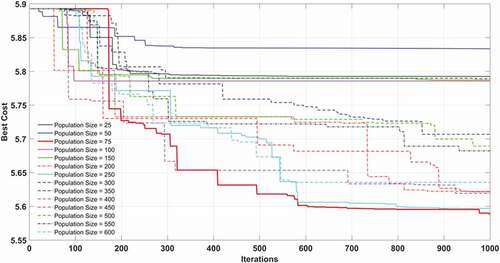
Figure 7. Proposed GA-ANFIS model validation. (a) Predicted and actual weight. (b) Error percentage. (c) Error histogram
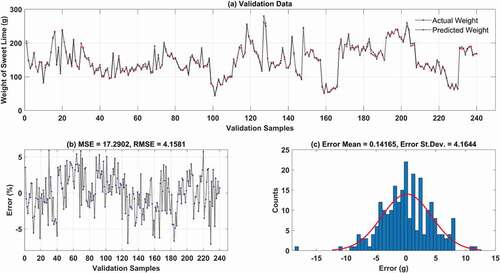
Table 6. Analysis of population size and ranking of PSO–ANFIS models
Table 7. Analysis of personal and global learning coefficients and ranking of PSO–ANFIS models
Table 8. Analysis of inertia weight and ranking of PSO–ANFIS models
Figure 8. Performance of PSO optimized ANFIS model for different population size
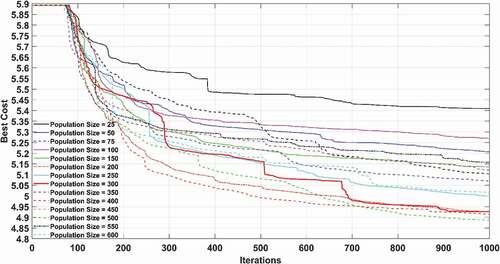
Figure 9. Performance of PSO optimized ANFIS model for different personal and global learning coefficients
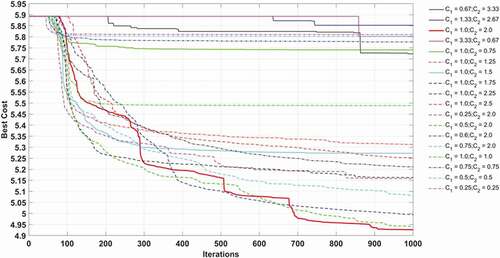
Figure 10. Performance of PSO optimized ANFIS model for different inertia weight
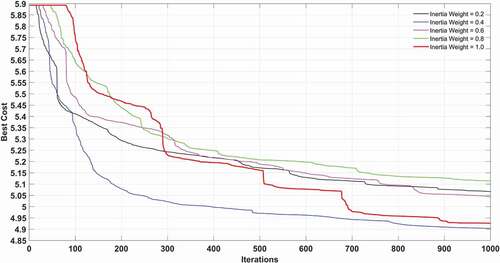
Figure 11. Proposed PSO-ANFIS model validation. (a) Predicted and actual weight. (b) Error percentage. (c) Error histogram
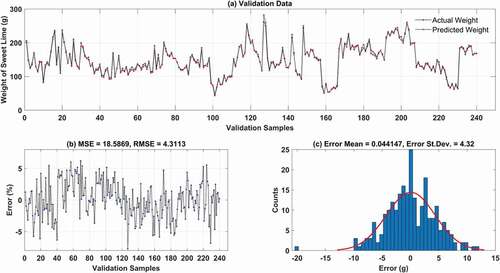
Table 9. Comparison of the different sweet lime weighing models
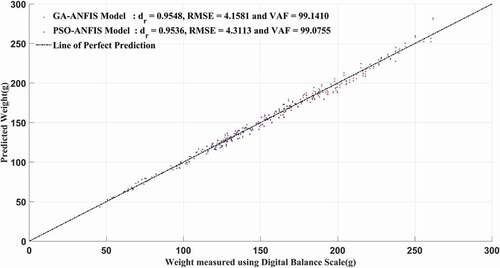
Figure 12. Comparison of the optimized ANFIS models for validation samples