
Figures & data
Table 1. Climatic variables during the evaluated season for Curicó and Pencahue, Chile
Table 2. Background of the sweet cherry cultivars plantation used in the study
Figure 1. Sweet cherry tree ‘Lapins’, ‘Sweetheart’ and ‘Regina’ formed in CL (above) before manual defoliation and (below) after manual defoliation. Curicó, Chile
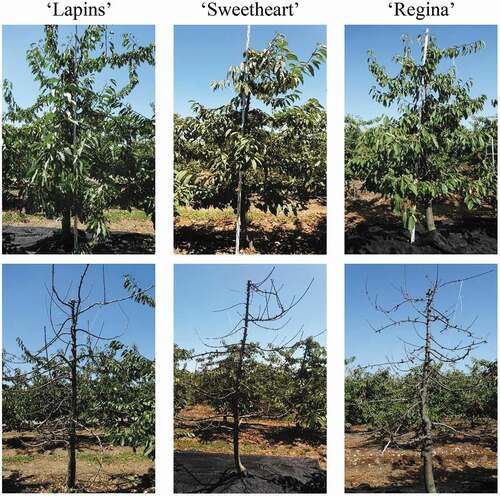
Figure 2. Sweet cherry ‘Bing’ and ‘Lapins’ formed in KGB (above) before manual defoliation and (below) after manual defoliation. Pencahue, Chile
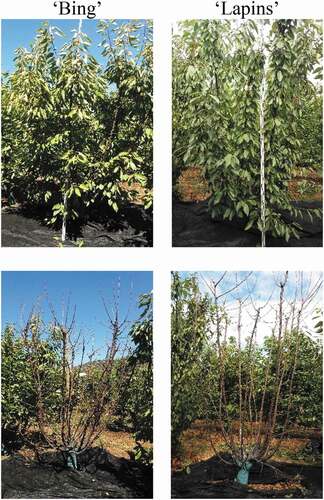
Table 3. Foliar indicators for the sweet cherry cultivar/rootstock combinations according to training system (CL and KGB). Leaf samples were taken 125 days after full bloom
Table 4.. Production efficiency indicators for the sweet cherry cultivar/rootstock combinations according to training system (CL and KGB). Leaf samples were taken 125 days after full bloom
Figure 3. Principal component analysis based on foliar and productive efficiency indicators in sweet cherry trees. a: scores plot with Hotelling’s T2 ellipse for cultivar/rootstock combinations and training system clusters (CL system: blue inner ellipse on II and III quadrant; KGB system: green inner ellipse on I and IV quadrant). b: correlations loadings show the most importance variables for the model. The outer ellipse indicates 100% explained variance and the inner ellipse indicates 50% of explained variance. DML: Leaf dry matter; LW: Leaf weight; LWD: Leaf dry weight; LWT: Leaf weight per tree; LWDT: Leaf dry weight per tree; LNT: Leaf number per tree; LA: Leaf area; LAT: Lear area per tree; LW/A: Leaf weight per leaf area; LAI: Leaf area index; Yield ha−1: Yield per hectare; Yield tree−1: Yield per tree; LN/F: Leaf number leaves per fruit; LW/F: Leaf weight per fruit; LA/F: Lear area per fruit; LW ha−1: Leaf weight per hectare; LWD ha−1: Leaf dry weight per hectare; LA ha−1: Leaf area per hectare; Yield/LA: Yield per leaf area
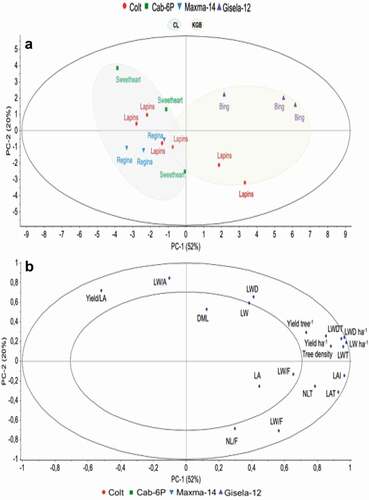
Table 5.. Foliar and productive efficiency indicators in sweet cherry trees ‘Lapins’/‘Colt’ conducted in CL and KGB