Figures & data
Table 1. Resistance profiles based on artificial inoculation of the blueberry cultivars used in this study previously rated by Polashock et al. (Citation2005) and Miles et al. (Citation2012).
Table 2. Area under the disease progress (AUDPC) values for the incidence of Colletotrichum fioriniae on various highbush blueberry cultivars and cross families screened by artificial inoculation in 2010 and 2011 at the Southwest Michigan Research and Extension Center (Benton Harbor, MI, USA). Fruit of 4- to 7-year-old bushes was inoculated when immature, harvested when ripe, incubated, and rated at 5, 8 and 12 days. Since the effect of year was statistically significant (P = .008), data from the two years were analyzed separately.
Figure 1. The proportion of all blueberry fruit decayed by Colletotrichum fioriniae after 5, 8 and 12 days of incubation at 100% RH and 22–23°C in 2010 and 2011. Fruit from the Southwest Michigan Research and Extension Center (Benton Harbor, MI) had been inoculated when immature and harvested when mature; data were averaged over all cross families and cultivars.
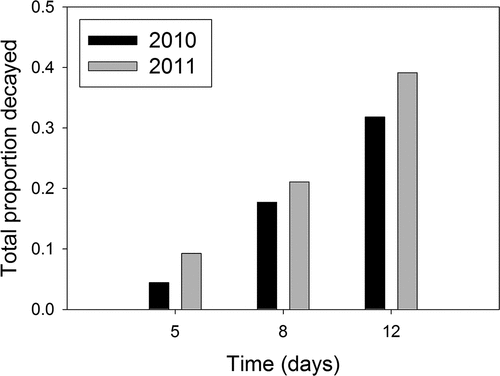
Figure 2. Frequency distribution of anthracnose fruit rot resistance, expressed as area under the disease progress curve (AUDPC), among daughters of A) a susceptible x moderate cross (‘Nelson’ x ‘Ozarkblue’) and B) a resistant x resistant cross (‘Bluegold’ x ‘Elliott’) in 2010 and 2011. Discrete levels were defined every 100 AUDPC values.
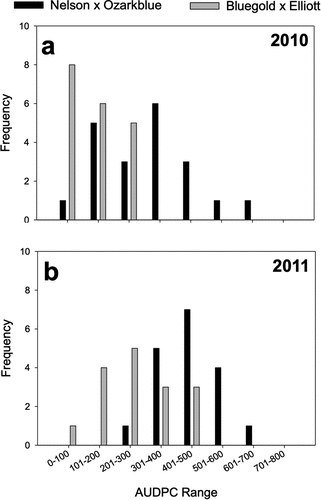
Figure 3. Correlation between the average anthracnose fruit rot incidence on various blueberry cultivars and cross families expressed as area under the disease progress curve (AUDPC) against actual and predicted proportion decayed values from Polashock et al. (Citation2005) in (A) 2010 and (B) 2011. Abbreviations for parent cultivars: BG = Bluegold; BR = Brigitta; DU = Duke; E = Elliott; LE = Legacy; N = Nelson;O = Ozarkblue.
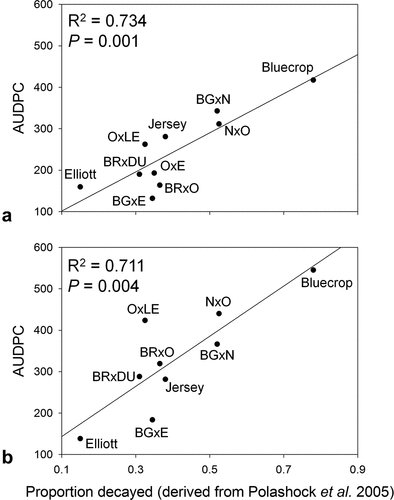
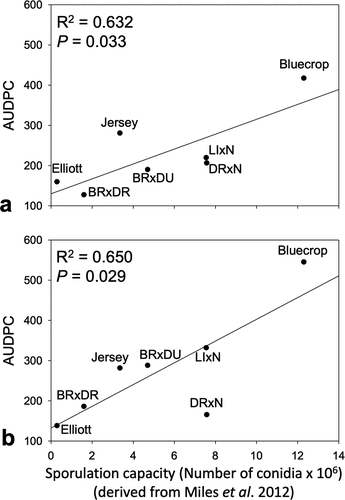
Figure 4. Correlation between the average anthracnose fruit rot incidence on various blueberry cultivars and cross families expressed as area under the disease progress curve (AUDPC) against actual and predicted sporulation capacity values from Miles et al. (Citation2012) in (A) 2010 and (B) 2011. Abbreviations for parent cultivars: BR = Brigitta; DU = Duke; DR = Draper; E = Elliott; LI = Liberty; N = Nelson.