Figures & data
Table 1. Minimum, maximum, mean values and standard deviations of selected walnut varieties
Table 2. The values of pori on pollen surface in selected walnut varieties (µm)
Table 3. The values of spinules on pollen surface in selected walnut varieties (µm)
Figure 1. Pollen shape (a, c, e, g, i, k, m, o) and exine patterns (b, d, f, h, j, l, n, p) of walnut varieties. Chandler (a, b), Fernette (c, d), Fernor (e, f), Pedro (g, h), Bilecik (i, j), Kaman 1 (k, l), Şebin (m, n), Şen 1 (o, p). Scale bars – 10 µm (a, c, e, g, i, k, m, o), 1 µm (b, d, f, h, j, l, n, p).
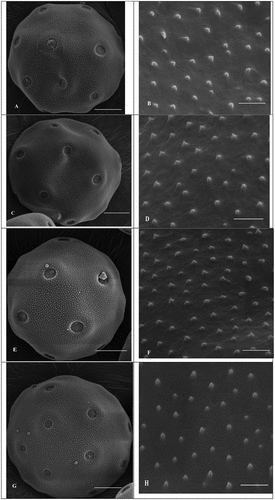
Figure 1. (Continued).
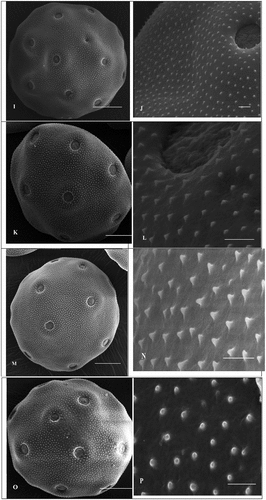
Table 4. Pearson correlation coefficients among traits in selected varieties
Table 5. Component loading in principle component analysis (PCA)
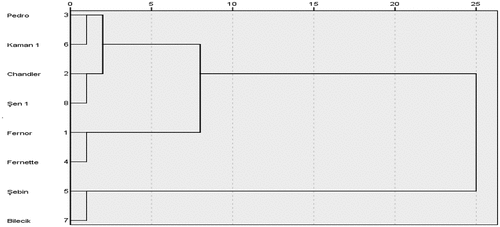
Figure 2. Dendrogram of hierarchical cluster analysis obtained by Ward’s clustering method.