
Figures & data
Table 1. Minimum and maximum ranges of independent variables
Table 2. Experimental design (Coded) of independent variables and studied responses for osmotic dehydration of peach (Shan-e-Punjab)
Table 3. Analysis of Variance for response variables
Table 4. Regression coefficient of dependent responses
Figure 1. Response surface plots showing effect of independent variables on studied responses a: Water loss, b: Solute gain, c: Rehydration ratio, d: Hardness and e: Overall acceptability.
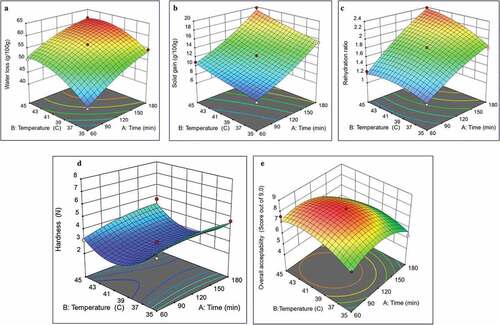
Table 5. Optimization criteria for different factors, response and solutions
Figure 2. Moisture content (g water/g dried mass) of peach slices conventionally dried at 60°C in cabinet drier. A: Previously osmo-dried using optimized conditions (sucrose concentration: 61.86 °Brix, time: 133 minutes and temperature: 41°C), B: Peach slices dried only in cabinet driver.
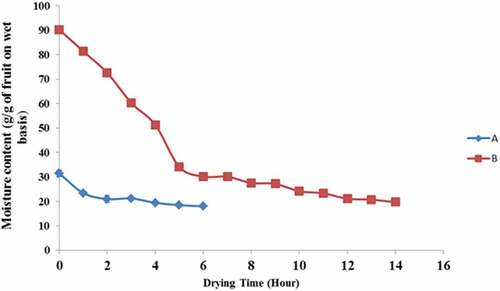
Figure 3. Sensory evaluation of dried peach slices using 9-point hedonic scale A: control (conventional dried sample) B: combined dried sample (osmotic and conventional drying).
Figure 4. Effect of storage on A: Total phenol context, B: Antioxidant activity,C: hue angle and D: overall acceptability during six months of storage, at refrigerated storage (4–7°C) and ambient temperature storage (28 ± 5°).
Table 6. Response of marginal peach farmers/ small scale food processors to various attributes of the low-cost peach preservation technique