
Figures & data
Table 1. Particle size distribution for each mulch type by percent of dry matter within each sieve size range. Mulches were applied to an organic wild blueberry field during the prune year in Stockton Springs, ME on May 20, 2020.
Table 2. Mulch treatment characteristics (pH, chemical composition, mean moisture content, dry matter application rate, and cost) for material applied to organic wild blueberry in Stockton Springs, ME. Mulch samples were collected on May 20, 2020, the same day as application. Costs represent those incurred during the current study but do not include labor costs. Prices are based on one application of each material applied at a 1.27 cm thickness.
Table 3. Soil analysis treatment means from soil sampling wild blueberry plots on July 30, 2021 after harvest in Stockton Springs, ME. Results include soil pH and buffer pH, percent organic matter (% OM), all major nutrients (nitrate [NO3], ammonium [NH4], phosphorus [P], potassium [K], and calcium [Ca]), micronutrients with statistical significance (manganese [Mn]), and cation exchange capacity (CEC). Rows not connected by the same letter are statistically different at the 0.05 level of significance based on Tukey’s HSD test.
Figure 1. Mean soil moisture content by date and mulch type for wild blueberry prune (2020) and crop (2021) years in Stockton Springs, ME. The blue line represents total rainfall and melted snow amounts. Error bars represent the SEM (n = 240). Points not connected by the same letter are statistically different at the 0.05 level of significance based on Tukey’s HSD test. Letters representing statistical significance are ordered from top down to correspond to the same order of treatments listed in the legend from top down to help distinguish among treatments. Precipitation data is from NOAA National Environmental Satellite, Data, and Information Service record of climatological observations for prospect, ME weather station.
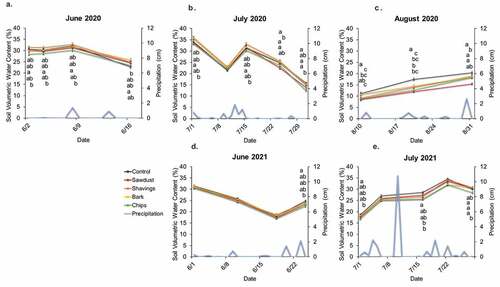
Figure 2. Mean wild blueberry stem height and number of buds per stem by mulch type. Error bars represent the SEM (n = 300). Bars not connected by the same letter are statistically different at the 0.05 level of significance based on Tukey’s HSD test.
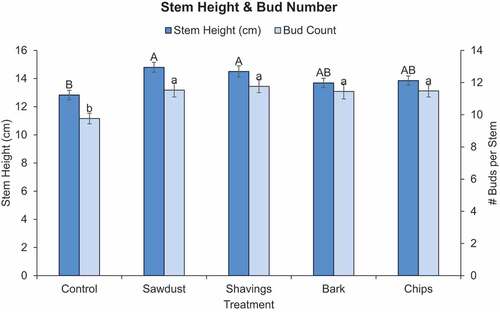
Table 4. Wild blueberry flower and fruit counts, plot yield, berry sample weights, and Brix sugar content as affected by mulch treatments during wild blueberry crop year (2021) growing season in Stockton Springs, ME. Flower, green fruit, and blue fruit counts were taken on 21 May, 18 June, and 28 July 2021, respectively. Plot yields and 100 berry weights were also taken on 28 July 2021. Brix measurements were taken 30 July 2021. Rows not connected by the same letter are statistically different at the 0.05 level of significance based on Tukey’s HSD test.
Table 5. Wild blueberry pest pressure as affected by mulch treatments during wild blueberry prune (2020) and crop (2021) years in Stockton Springs, ME. All measures were collected once per month in June, July, and August in 2020 and 2021. Rows not connected by the same letter are statistically different at the 0.05 level of significance based on Tukey’s HSD test. *significant at the 0.05 level of significance.
Figure 3. Monthly mean wild blueberry disease cover as a percent representing the midpoint of the mean rank range. Data collected on June 19, July 15, and August 20 in 2020 during the prune cycle. Error bars represent the SEM (n = 60). Bars not connected by the same letter are statistically different at the 0.05 level of significance based on Tukey’s HSD test.
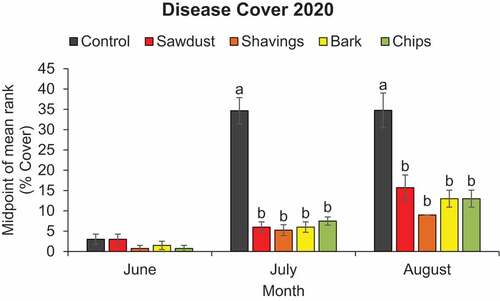
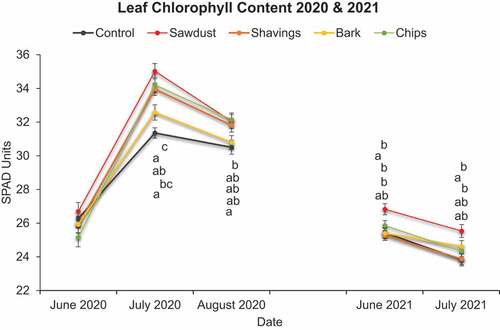
Figure 4. Monthly mean wild blueberry leaf tissue chlorophyll content in spad units by mulch type. Error bars represent the SEM (n = 1,200). Points not connected by the same letter are statistically different at the 0.05 level of significance based on Tukey’s HSD test. Letters representing statistical significance are ordered from top down to correspond to the same order of treatments listed in the legend from left to right to help distinguish among treatments.
Data Availability Statement
The data that support the findings of this study are available from the corresponding author, RG, upon reasonable request. https://doi.org/10.6084/m9.figshare.c.5756594