Figures & data
Figure 1. Incidence of ‘Red Globe’ grape downy mildew in different years.
Figure 2. Temperature of ‘ Red Globe ‘ field vineyards in different years.
Figure 3. Effects of grape downy mildew on net photosynthetic rate, stomatal conductance and intercellular CO2 concentration of leaves after different temperature treatments. DM+HT represents downy mildew and high temperature treatment, CK+HT represents only high temperature treatment, DM+LT represents downy mildew and normal temperature treatment, CK+LT represents normal temperature treatment. Data in the figure are mean ±standard error. The numerical values with different letters are significantly different (P < .05).
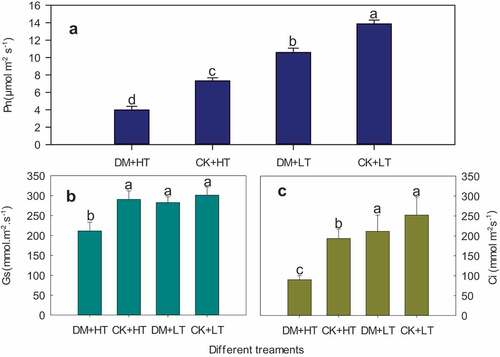
Figure 4. Effects of grape downy mildew on ΦPSII, PIABS, Fv/Fm and Fv/Fo of leaves after different temperature treatments. DM+HT represents downy mildew and high temperature treatment, CK+HT represents only high temperature treatment, DM+LT represents downy mildew and normal temperature treatment, CK+LT represents normal temperature treatment. Data in the figure are mean ±standard error. The numerical values with different letters are significantly different (P < .05).
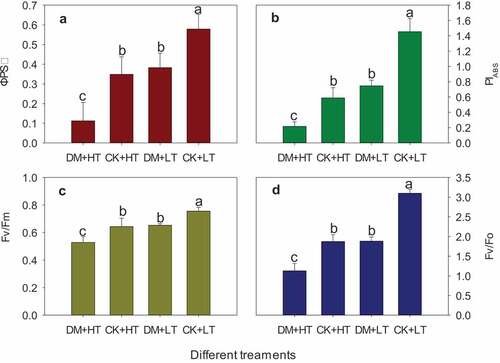
Figure 5. Effects of grape downy mildew on 1-qP, RC/CSm and WK of leaves after different temperature treatments. DM+HT represents downy mildew and high temperature treatment, CK+HT represents only high temperature treatment, DM+LT represents downy mildew and normal temperature treatment, CK+LT represents normal temperature treatment. Data in the figure are mean ±standard error. The numerical values with different letters are significantly different (P < .05).
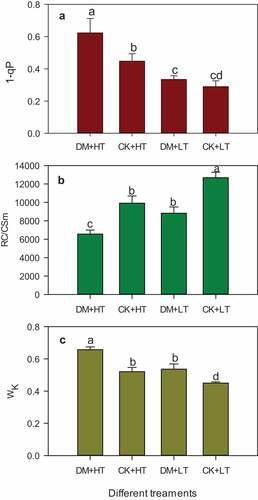
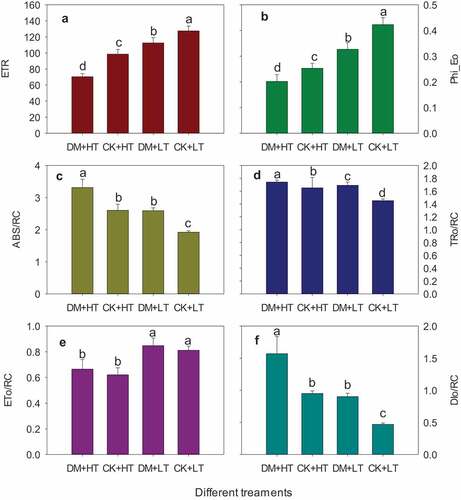
Figure 6. Effects of grape downy mildew on ETR and energy distribution of leaves after different temperature treatments. DM+HT represents downy mildew and high temperature treatment, CK+HT represents only high temperature treatment, DM+LT represents downy mildew and normal temperature treatment, CK+LT represents normal temperature treatment. Data in the figure are mean ±standard error. The numerical values with different letters are significantly different (P < .05).