
Figures & data
Figure 1. Map of strawberry fruit production districts and plant production areas (nurseries). Cartography by Bill Nelson.
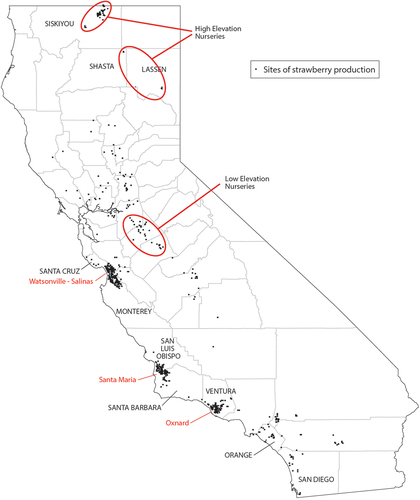
Figure 2. California strawberry fruit producing hectarage and yield per hectare from 1950 – 2022.
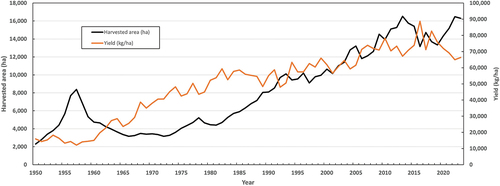
Table 1. Top 10 strawberry producing countries in the world in 2021, sorted in descending order according to production per unit area, total production and harvested area.
Figure 3. Nursery growing practices. Low plastic tunnels (left) and daughter plant production in space between mother plants (right).
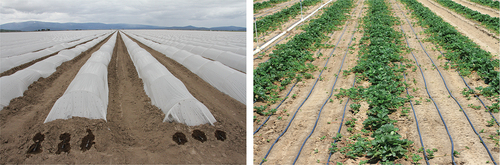
Figure 4. Stacked line chart showing the change in the proportion of fall- and summer-planted strawberries in the Santa Maria district from Citation2009 – 2022.
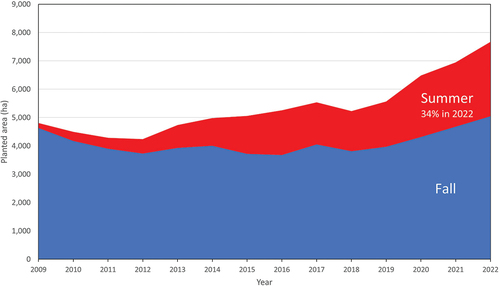
Figure 5. California strawberry production volume by district and time of year. Filled areas are the three-year average while lines show the current year (2022). Production volume is shown in “trays” which weigh 4 kg. Peak yield from fall plantings occurs in April (Southern district/Oxnard) and May (Santa Maria) while peak yield for summer plantings occurs in September-October (Santa Maria) and October-November (Southern distict/Oxnard). (Source: www.calstrawberry.com).
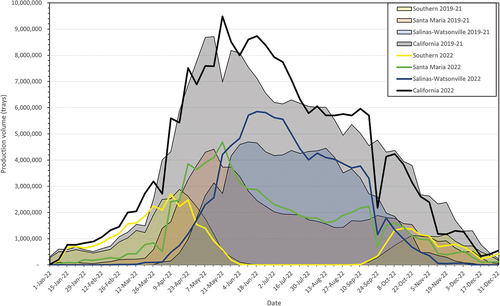
Figure 6. The two bed configurations used in California: four lines of plants on 64-inch beds (1.6 m) covered in zebra plastic (left) used in Oxnard and Santa Maria; 2 lines of plants on 52-inch beds (1.3 m) covered in gray plastic (right) used in Watsonville-Salinas.
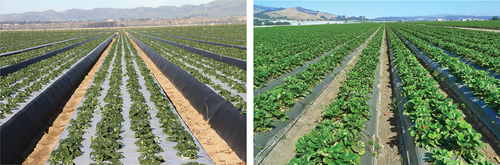
Figure 7. High plastic tunnels is a production system used in a limited number of acres to protect the fruit from rain and direct sunlight (left). Tabletop production (right) utilizes soilless growing medium in raised troughs for upright posture during harvest and elimination of soilborne pathogens.
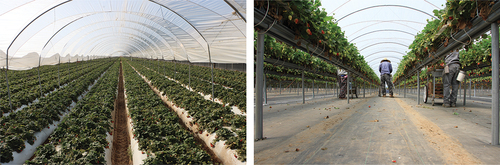
Table 2. Plastic mulch types and purposes, listed in descending order of popularity.
Figure 8. Stacked line chart showing the proportions of organic and conventional strawberry acreage during the period when organic acreage was tracked (2001 – 2023).
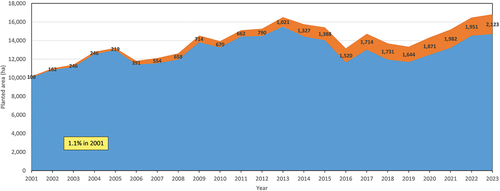
Figure 9. Top 10 most popular public cultivars grown in California between 1993 and 2023 as measured by total planted area over time.
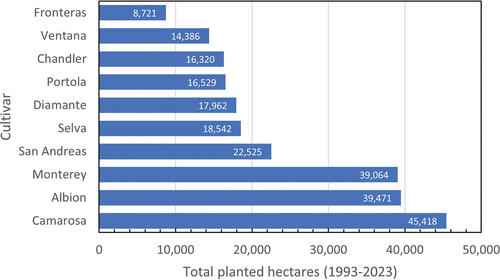
Figure 10. Hand harvesting strawberries into 1-lb (454 g) plastic clamshells placed in fiberboard trays.
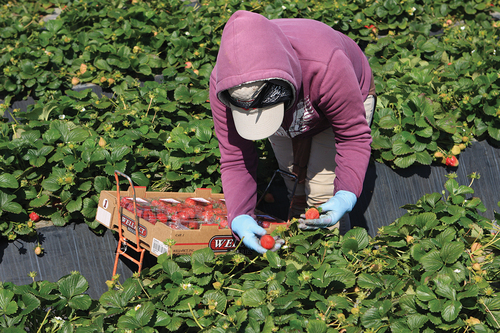
Figure 11. Harvesting aids “mercado” (left) and furrow-guided tongue (insert) and “Harvest Pro” (right) improve labor efficiency by reducing the time required to transfer and palletize boxes at the edge of the field.
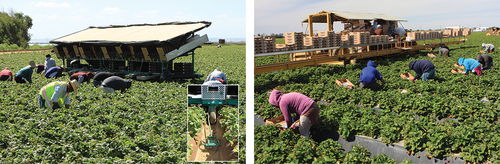
Figure 12. Advanced Farm’s robotic harvester doing field-scale harvesting.
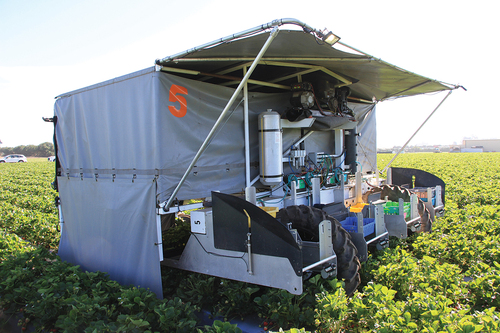
Figure 13. A recently optimized tractor-mounted bug vacuum improved the efficacy of removing Lygus bugs by 2.2 times over the previous version (Wells et al., Citation2020).
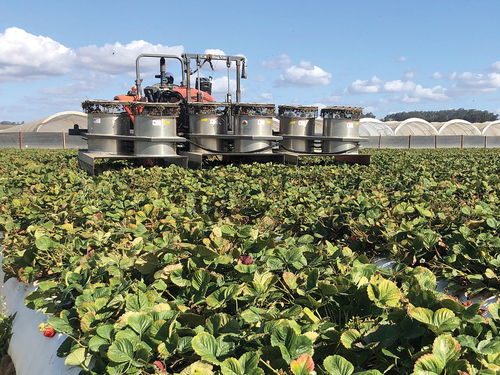
Table 3. Top 10 destinations for strawberries exported from California in 2022.