
Figures & data
Figure 1. Grape damage changes are rated through split rate (a), shatter rate (b), decay (c) rate and mold rate (d) in clusters. The clusters with acetic acid (acid), Chitosan and diH2O treatment are in cold storage and collected for rating at 1, 3, 5, 7 weeks. The cluster damages are rated by split, shattering, decay, and mold rate. The postharvest grape appearance is evaluated by destructively sampled at each treatment. Different letters (a, b, c, d) correspond to mean values significantly different (p < .01) by analysis of variance (ANOVA) and Tukey post hoc test.
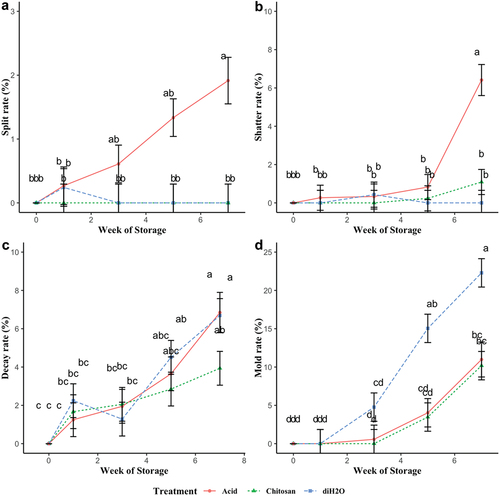
Figure 2. Stacked bar chart of the total damage in average with acetic acid, chitosan and diH2O as postharvest treatments. The damages include decay, mold, shattering and split rate by percentage. Treatments include acetic acid (a), chitosan (b) and diH2O (c) treatment. The red dashed line indicates the 10% damage threshold for grape bunches to meet quality acceptance standards of the U.S. Department of Agriculture (USDA) for table grapes.
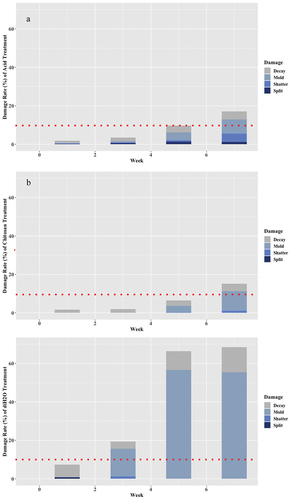
Figure 3. Grape cluster rachis rate with each treatment during storage. Each rachis from each cluster is collected at week 0, 1, 3, 5 and 7. Rachis dehydration is scored from 1 (all green rachis) to 5 (all brown rachis). (a) Rachis index changes during storage. Different letters (a, b, c) correspond to mean values significantly different (p < .01) by analysis of variance (ANOVA) and Tukey post hoc test. (b) Representative photo of rachis with different treatment.
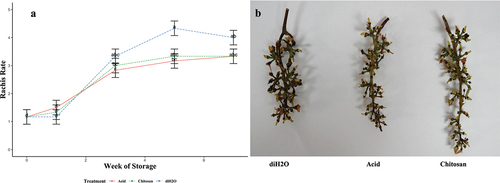
Table 1. ‘Sommerset Seedless’ postharvest physicochemical characteristics under postharvest treatment.
Table 2. Effect of different postharvest treatments on ‘Somerset Seedless’ total phenolic, flavonoid content and antioxidant component activity levels.