Figures & data
Table 1. Experimental design of different gibberellin treatments.
Figure 1. Berry longitudinal diameter (a) and shape index (b) of ‘Shine Muscat’ fruit subjected to different GA3 treatments. Different lower-case letters indicate significant differences among treatments (n= 3, Duncan’s test, p<.05).
Figure 2. Berry weight (a) and volume (b) of ‘Shine Muscat’ fruit subjected to different GA3 treatments. Different lower-case letters indicate significant differences among treatments (n= 3, Duncan’s test, p<.05).
Figure 3. TSS (a) and the sugar/acid (b) of ‘Shine Muscat’ fruit subjected to GA3 treatments. Different lower-case letters indicate significant differences among treatments (n = 3, Duncan’s test, p <.05).
Figure 4. Firmness of ‘Shine Muscat’ fruit subjected to GA3 treatments. Different lower-case letters indicate significant differences among treatments (n= 3, Duncan’s test, p <.05).
Figure 5. Berry cell density in grapes subjected to GA3 treatments. Different lower-case letters indicate significant differences among treatments (n= 3, Duncan’s test, p <.05).
Figure 6. Cross-sectional microstructure of central vascular bundles (e-h) of ‘Shine Muscat’ grapes under CK (a-c), T1 (d-f), T2 (g-i) and T3 (j-l) treatments at the first rapid growth stage、veraison and the second rapid growth stage. X: xylem; P: phloem; V: vessel; Scale bar =100 μm.
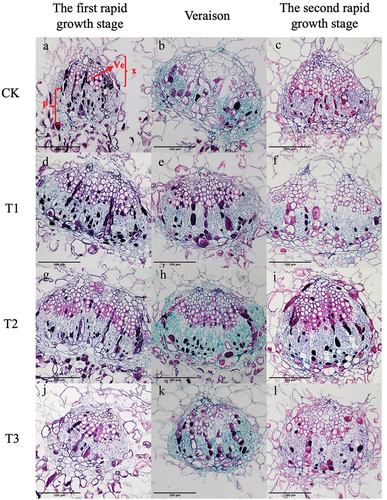
Figure 7. Areas of the central vascular bundle (Cvb) of ‘Shine Muscat’ grapes under different treatments during three stages of growth.Av: vascular bundles area, Ap: phloem area, Ax: xylem area. Different lower-case letters indicate significant differences among treatments (n= 3, Duncan’s test, p <.05).
Figure 8. Cross-sectional microstructure of peripheral vascular bundles (e-h) of ‘Shine Muscat’ grapes under CK (a-c), T1 (d-f), T2 (g-i) and T3 (j-l) treatments at the first rapid growth stage (a、d、g、j)、veraison(b、e、h、k) and the second rapid growth stage (c、f、i、l). (X: xylem; P: phloem; Ve: vessel) Scale bar =100 μm.
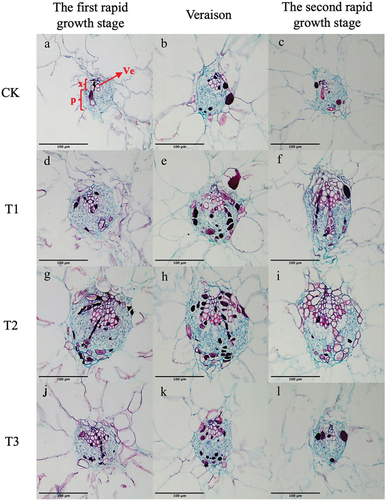
Figure 9. Areas of the peripheral vascular bundles (pvb) of ‘Shine Muscat’ grapes under different treatments during three stages of growth.Av: vascular bundles area, Ap: phloem area, Ax: xylem area. Different lower-case letters indicate significant differences among treatments (n = 3, Duncan’s test, p <.05).
Figure 10. Number of vessels in the xylem of the central vascular bundles (Cvb) and peripheral vascular bundles (Pvb) of ‘Shine Muscat’ under different treatments during three stages of growth. Different lower-case letters indicate significant differences among treatments (n = 3, Duncan’s test, p <.05).
Figure 11. Dye transport distribution in ‘Shine Muscat’ grapes in the first rapid growth stage (A-H), veraison (I-P), and the second rapid growth stage (Q-X) subjected to CK(a、e、i、m、q、u)、T1(b、f、j、n、r、v)、T2(c、g、k、o、s、w) and T3(d、h、l、p、t、x) treatments.
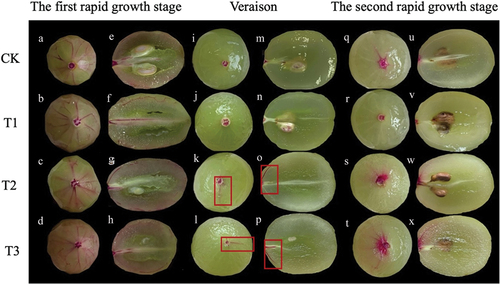
Figure 12. Relative abundance (white bars) of vessels in five diameter classes in the central vascular bundles of “Shine Muscat” grapes subjected to the CK, T1, T2, and T3 treatments and their relative correlation to the potential area-specific hydraulic conductivity (K, in percentage, black bars) at the first rapid growth stage (a), veraison (b) and the second rapid growth stage (c). Different lower-case letters indicate that there are differences in vessel abundance of different classes, and different upper-case letters indicate that there are differences in K (n = 3, Duncan’s test, p < .05).
Figure 13. Relative abundance (white bars) of five vessel diameter classes in the peripheral vascular bundles of “Shine Muscat” grapes subjected to CK, T1, T2, and T3 and their relative correlation to the potential area-specific hydraulic conductivity (K, in percentage, black bars) at the first rapid growth stage (A), veraison (B) and the second rapid growth stage (C). Different lower-case letters indicate that there are differences in vessel abundance of different classes, and different upper-case letters indicate that there are differences in K (n = 3, Duncan’s test, p < .05).
Figure 14. Sugar offloading of “Shine Muscat” grapes during veraison and the second rapid growth stage subjected to different gibberellin treatments. Different lower-case letters indicate that there are significant differences (n = 3, Duncan’s test, p < .05).