Figures & data
Figure 1. Multivariate Estimates of Opposition to Women Political Leaders.
Note: Dots and triangles represent estimated proportions of respondents who oppose women political leadership (prime minister and defense minister, respectively) by respondent attributes, and the lines are 95% confidence intervals from the regression model.
Figure 2. Policy Stereotypes Among Japanese and American Voters.
Note: The X-axis shows the average value across all respondents for each policy issue domain, with a value of 1 if the respondent answered that men politicians are better suited, −1 if the respondent answered that women politicians are better suited, and 0 if the respondent answered neither. No comparable data are available on birthrate, social welfare, and diplomacy issues in the US survey (Dolan Citation2014a).
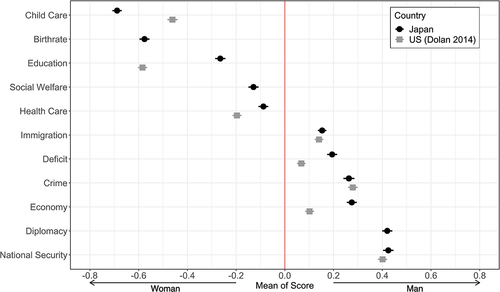
Figure 3. Personal Trait Stereotypes Among Japanese and American Voters.
Note: The X-axis shows the average value across all respondents for each personality trait, with a value of 1 if the respondent answered that men politicians are more applicable, −1 if the respondent answered that women politicians are more applicable, and 0 if the respondent answered neither. No comparable data are available on trust and competence attributes in the US survey (conducted by Dolan Citation2014a).
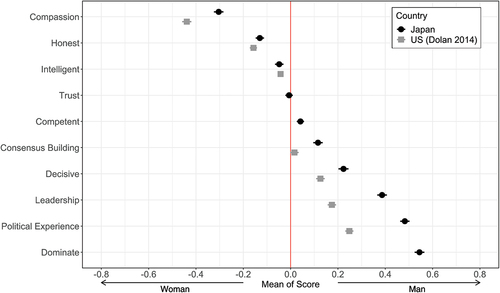
Table 1. Results of Logistic Regression on Gender Stereotypes Toward Policy Issue Domains.
Table 2. Results of Logistic Regression on Gender Stereotypes Toward Personality Traits.
Table A1. Summary Statistics of Respondent Attributes.
Table C1. Univariate Results of List Experiment.
Table C2. Estimated Coefficients from the Regression Models.
Figure F1. Policy Domain Stereotypes by Respondents’ Gender
Note: The X-axis shows the predicted value for respondents’ gender, with a value of 1 indicating that the respondent exhibits gender-based stereotypes. The lines indicate the 95% confidence intervals.
Figure F2. Personality Trait Stereotypes by Respondent Gender
Note: The X-axis shows the predicted value for respondents’ gender, with a value of 1 indicating that the respondent exhibits gender-based stereotypes. The lines indicate the 95% confidence intervals.